
As the owner or admin, you can see what your team is working on and find ways to improve productivity. You will get a clear view of each employee's performance, helping you manage your team more efficiently.
On the RemoteTrack panel, you can view individual employee activities, including screenshots, app usage, and website visits, along with the time spent and activity percentage.
RemoteTrack has been split into three parts:
1. Screenshot
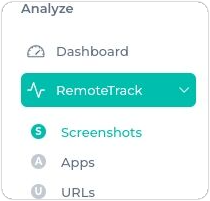
Once you have logged into your dashboard, navigate to the left-side panel. Click on the drop-down menu under RemoteTrack and select Screenshots. You can use the filters to view specific results based on your preferences.
You can filter the screenshots by selecting the relevant project to view project-specific results. Simply choose the desired project and team member, or only a member from the dropdown menu.
For more detailed tracking, you can select the Tasks option if there are any tasks under the project you have chosen.
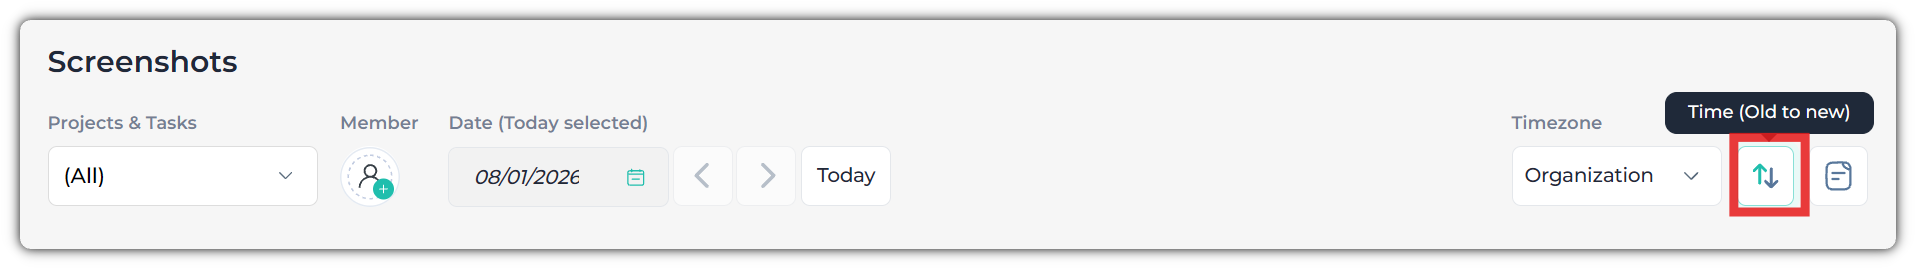
At the top right of this section, you will find a "Sort By" option, allowing you to customize the order of the screenshots. You can choose between two options: Displaying the newest screenshots at the top or showing the oldest screenshots first.
You will find another detail below:
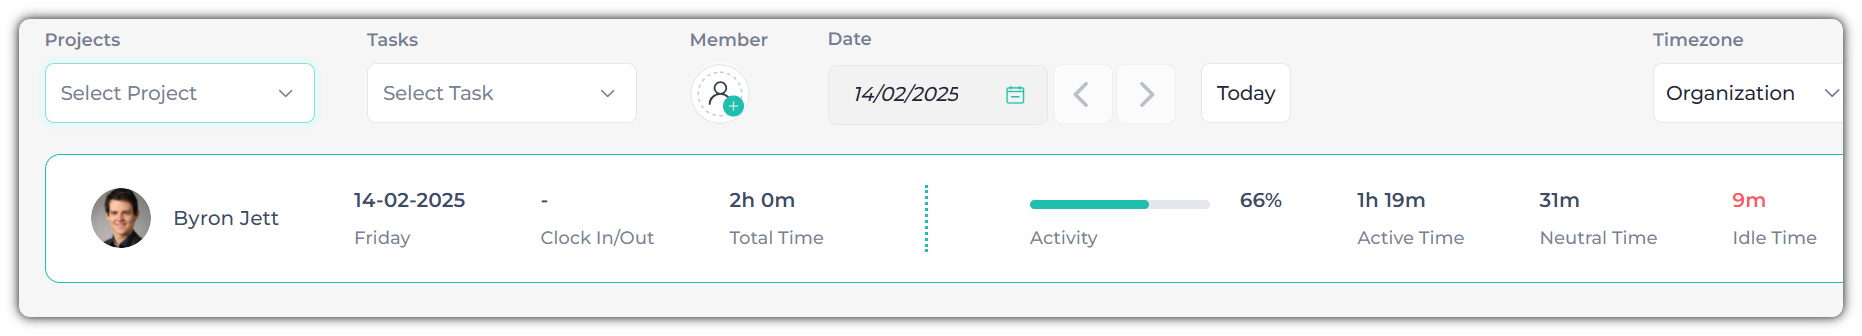
You can view your employee's clock-in/out times, activity level, active time, neutral time, and idle time for a specific date.
Additionally, one of the key features of Apploye is the screenshot functionality, which you can explore in several ways:
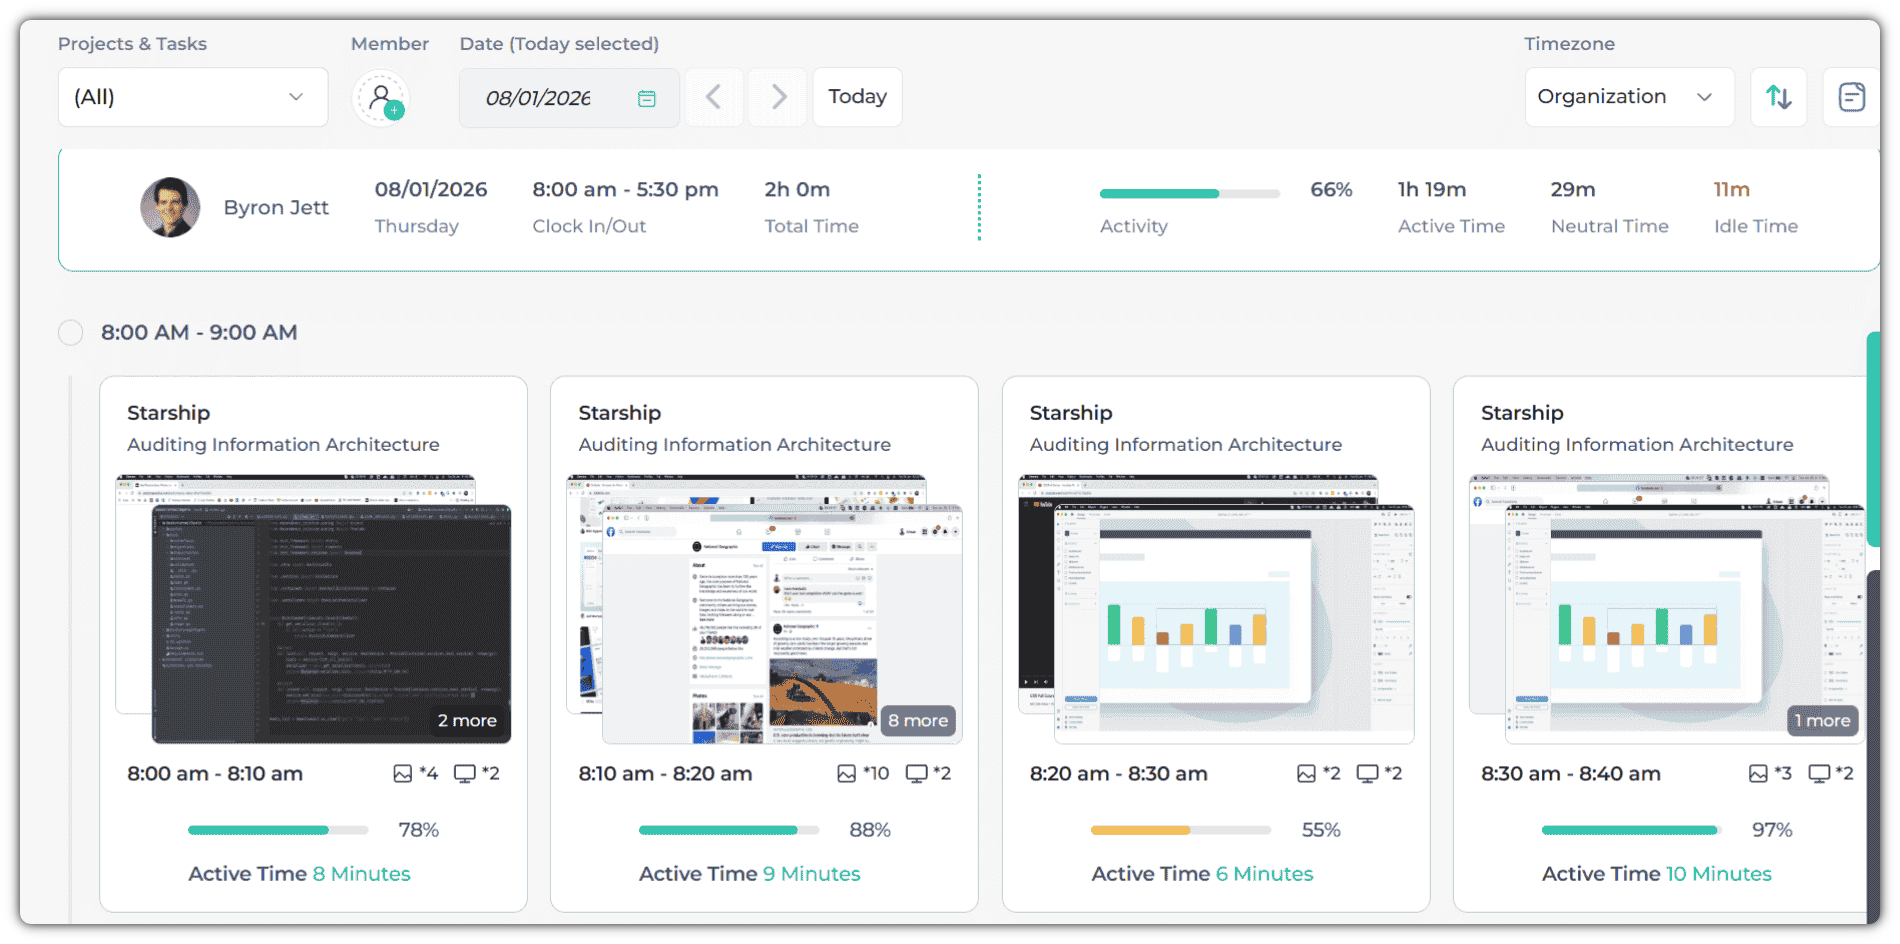
At the top, it has a one-hour time frame to see the screenshot “8:00 AM - 8:10 AM”
. Then you will find your project name is “Starship” and the screenshots associated with this project.
To the right of that, you will notice a monitor icon, which indicates the number of monitors the employee is using. Apploye is capable of monitoring multiple monitors simultaneously, with three screenshots captured every 10 minutes at a random time.
With the activity percentage, you can see the precise activity ratio for each 10-minute interval captured by the screenshots.
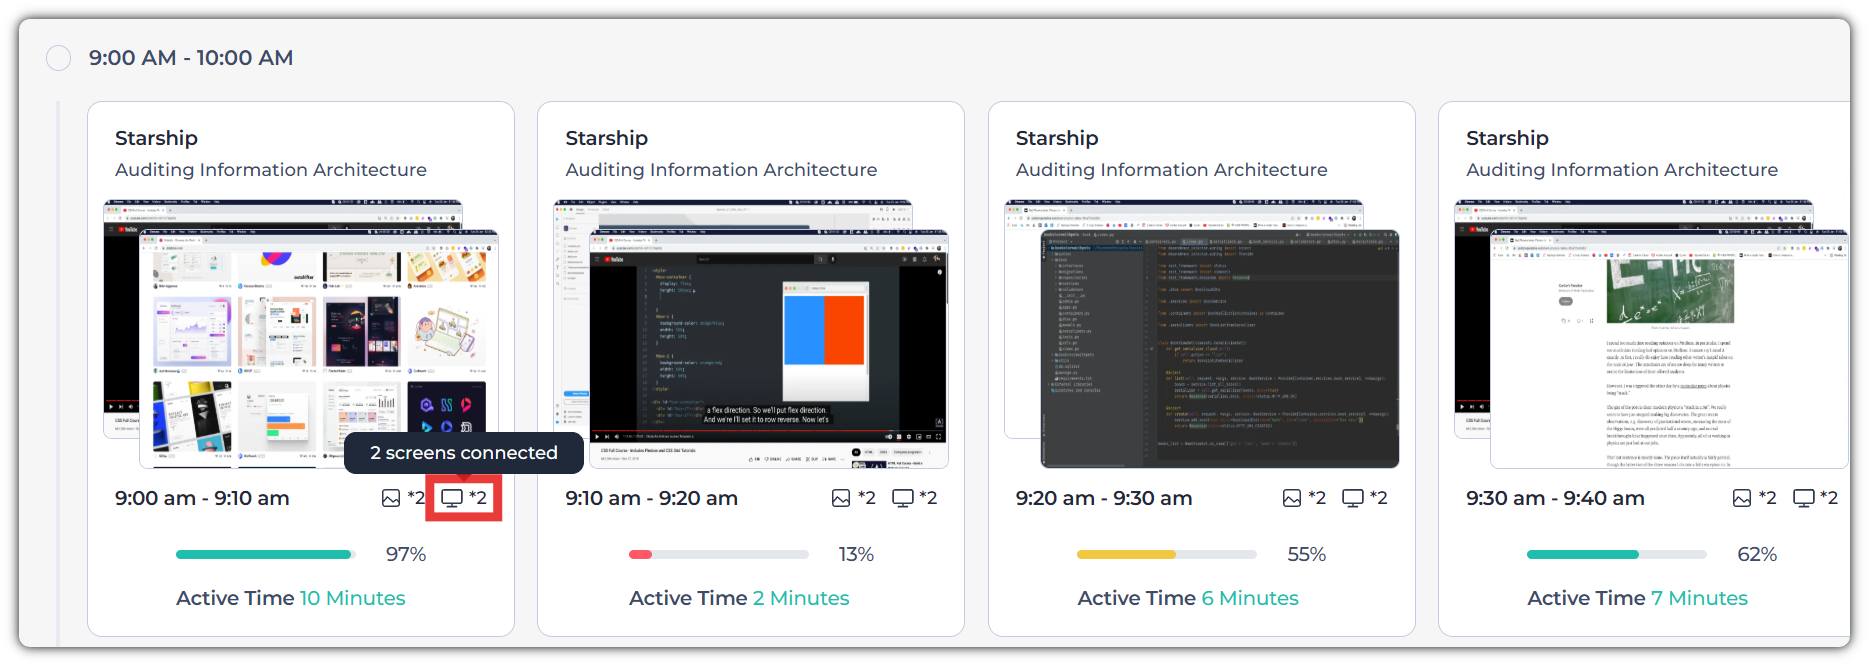
Also, those percentages with different colors resemble different productivity ratios:
- Red (0% - 30%)
- Yellow (30% - 60%)
- Radiant (60% - 100%)
2. APPS
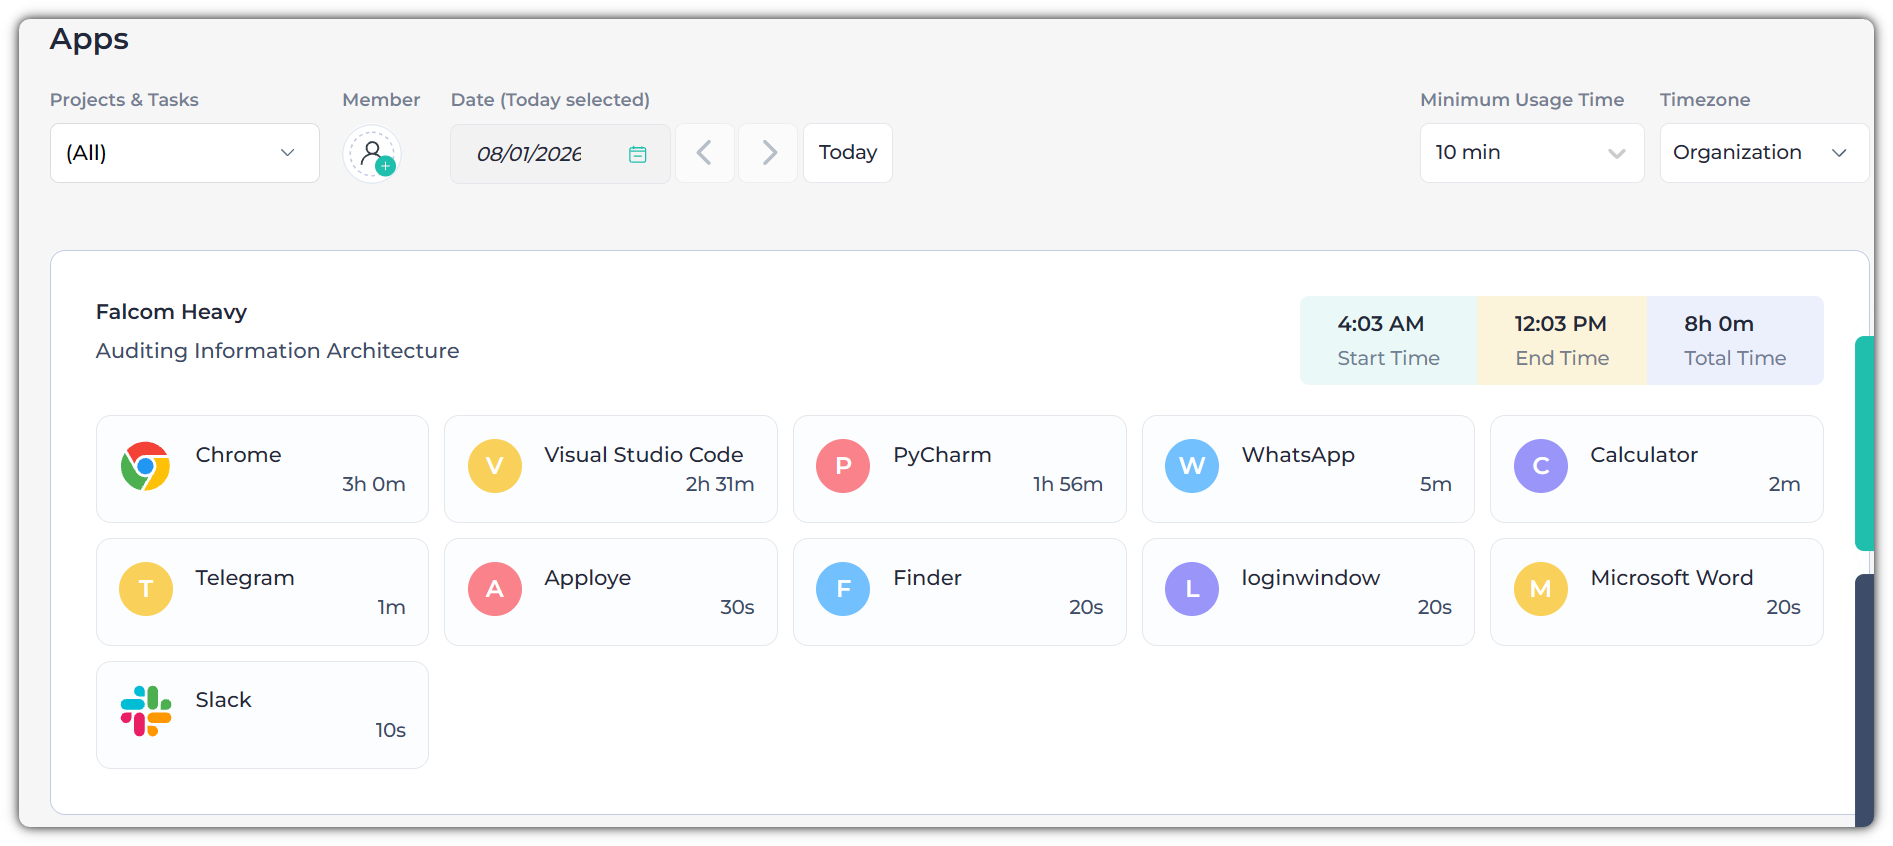
The activity section for apps follows the same filtering process as the screenshot section, allowing you to filter by project, task, and assignee. You will need to select the appropriate project, task (if applicable), and team member.
After selecting the project along with the member or just the member alone, both owners and admins will be able to view the app usage data.
Admins and owners can view their employees' start and end times, along with the total hours worked. They will also see how many apps were used during that time, along with the specific usage time for each app.
3. URLs
After selecting the employee or project & employee, you will be able to view their URL usage, the time spent, and the total working hours for the day.
By changing the date, you can access data from previous days, including screenshots, app usage, and URL activity.