
The RemoteTrack feature enables precise monitoring of employee activity. It consists of four key components.
- Screenshots: Captures periodic screenshots to provide visual proof of work and ensure accountability.
- Apps Usage Tracking: Monitors which applications employees use and how long they spend on each.
- URL tracking: Records visited websites to help assess productivity and online activity
- Activity and Engagement Analytics: Analyzes mouse movements and keyboard activity to measure engagement and overall productivity.
To track and monitor employee productivity, open the RemoteTrack panel from the left sidebar.
1. Screenshots
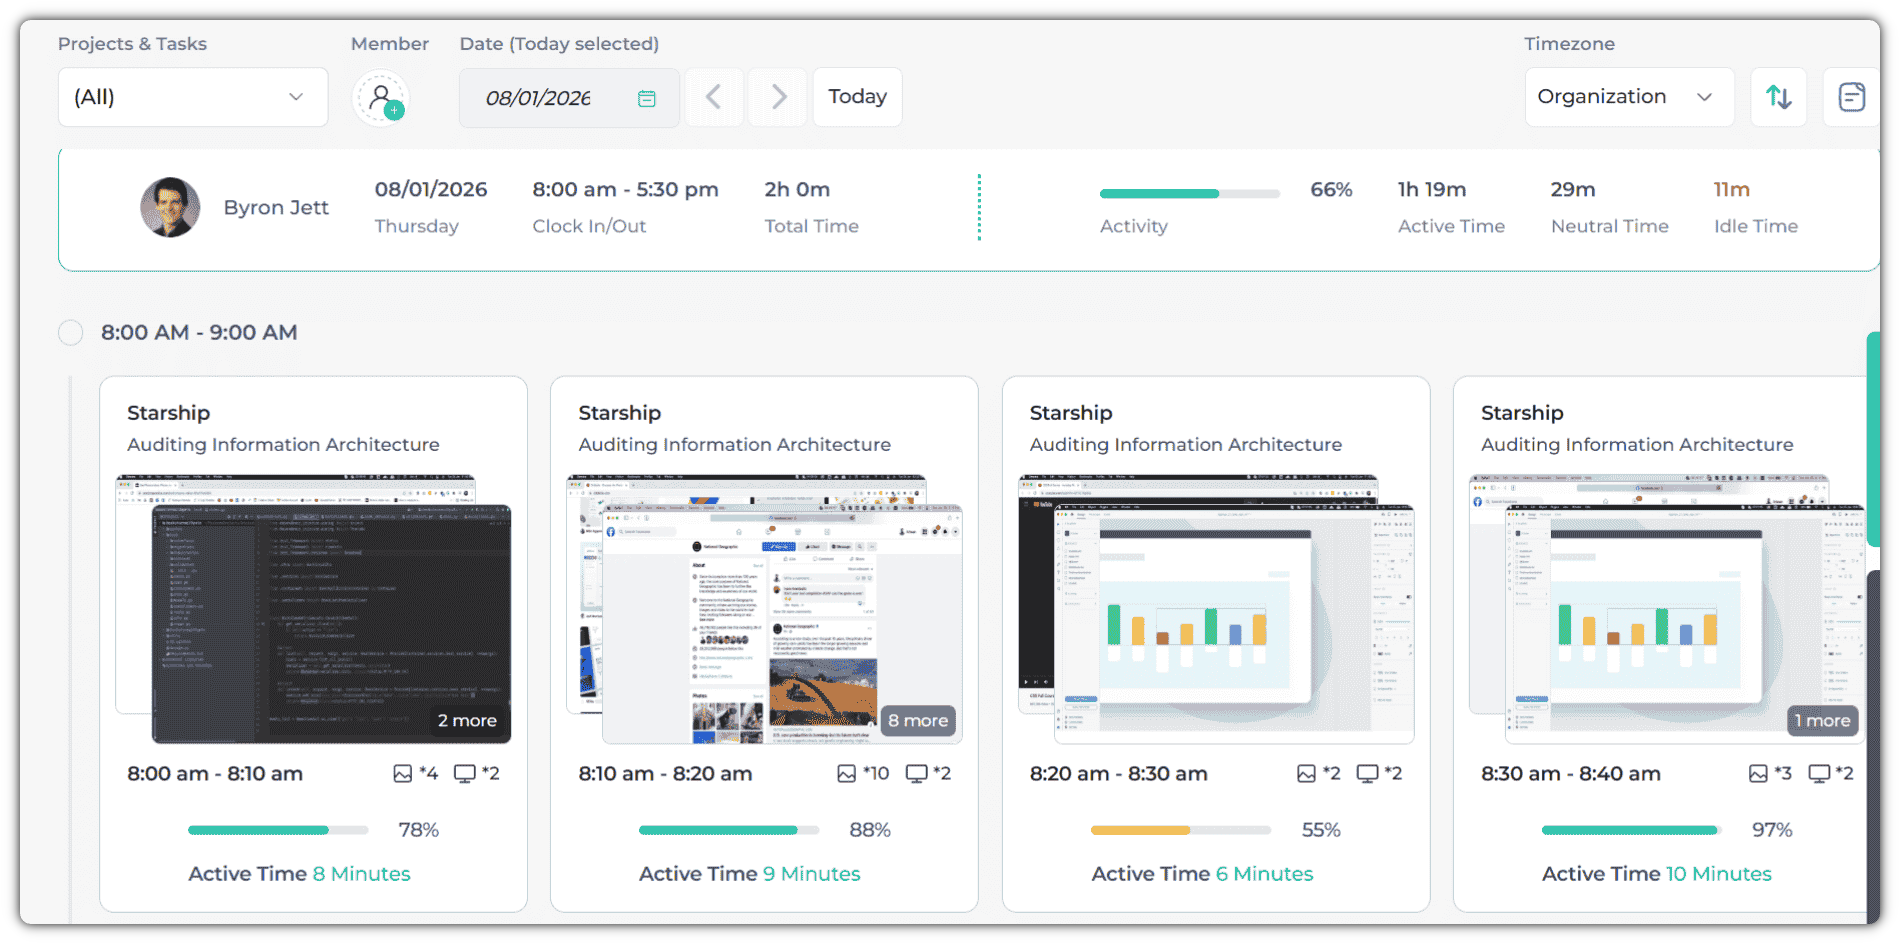
You can filter records by Project, Task, Employee, or Date. Simply click the Today button to quickly return to the current day’s screenshots.
By default, one screenshot is captured every 10 minutes. However, the organization owner or admin can adjust the capture rate and frequency in Activity Settings.
Settings > Activities.
Here you will find the Set Screenshots Frequency option.
The Apploye Desktop App captures screenshots at random intervals, ensuring that employees cannot predict the exact timing of the next screenshot.
It takes screenshots from multiple monitors. You can view these screenshots from the carousel by clicking on any screenshot.
You can hover over the mini image/monitor icons to see how many screenshots are being taken and how many monitors are connected.

Employees can delete screenshots by providing a reason; however, the organization owner or admin can prevent this by disabling screenshot deletion in Activity Settings.
If there are any missing screenshots, you can hover over the question mark and see the potential reasons. You can also check this Why is there No Image? article to learn more.
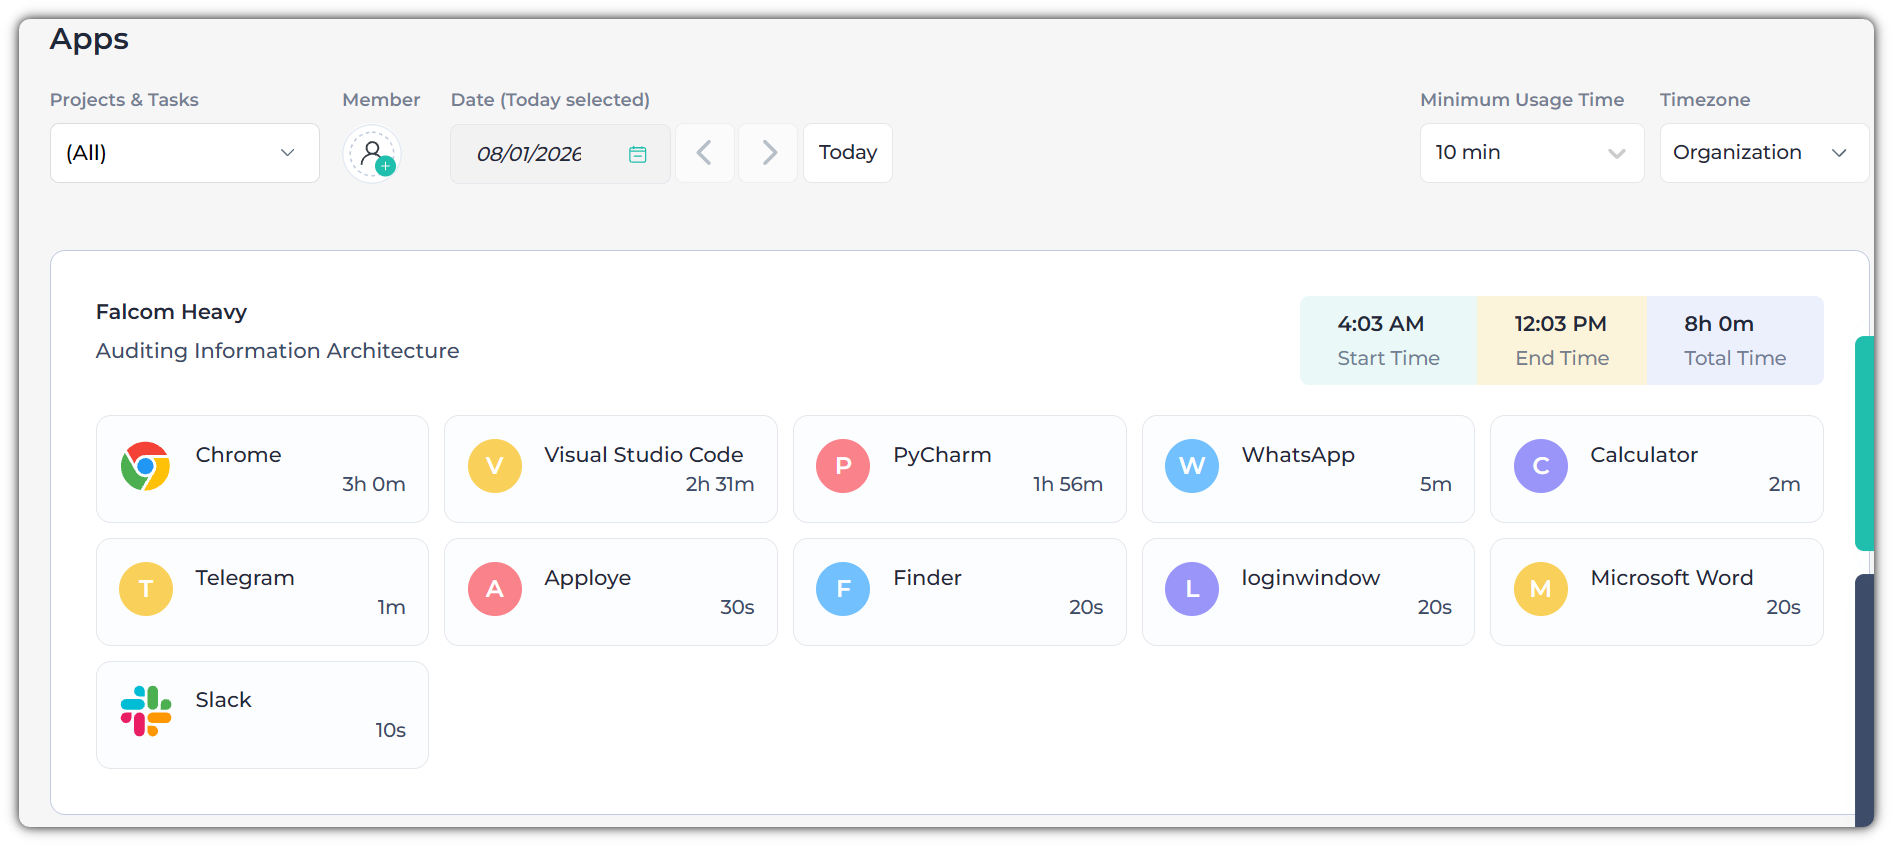
2. Apps
The software/applications used during working time will be shown here, e.g., Google Chrome, Slack, Skype, etc. View the exact time spent on each application.
3. URLs
Monitor which URLs employees visit during their clocked-in time and the duration of each visit, including all subdomains.
4. Activity Analytics
You can view the activity percentage on the Screenshots page, as well as in Reports, for a more comprehensive overview.
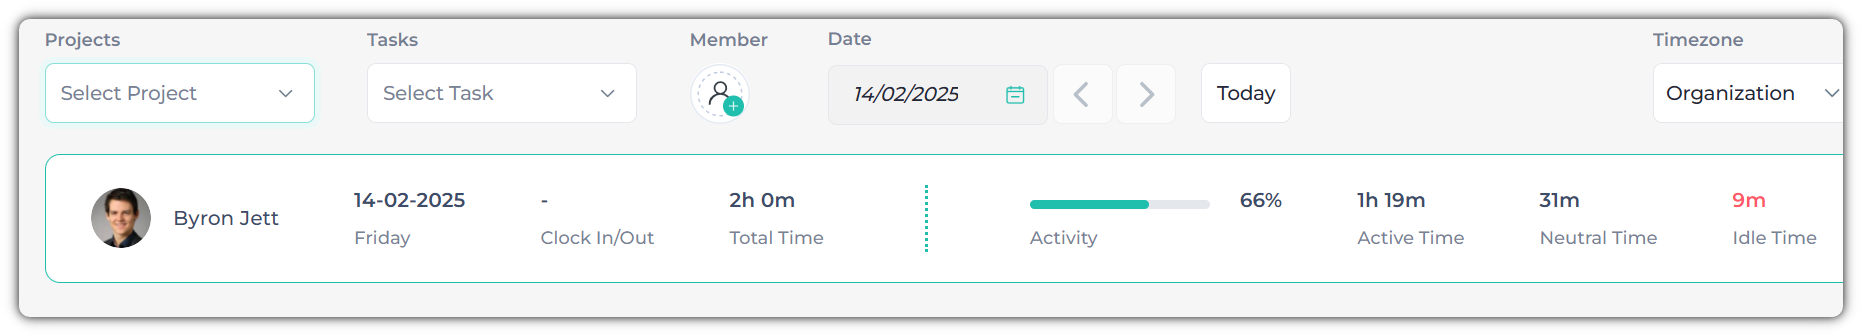
Monitor productivity using the Activity Percentage, which provides a breakdown of Active, Neutral, and Idle time, along with the total hours worked.
Colors are used to indicate the level of productivity:
1. Green- Activity above 60%
2. Yellow- Activity between 30% and 60%
3. Red- Activity below 30%
Activity is measured based on keyboard typing, mouse movements, and scrolling.
Still have any questions 🫠?
Message us in the Live chat 💬 or mail us at support@apploye.com ✉️