Workforce Analytics: Definition, Types, and Examples
Workforce analytics uses real data—like employee performance, retention rates, and attendance records—to guide better decisions in companies. It’s a powerful way to improve hiring, productivity, retention, and overall workplace satisfaction.
Once you grasp workforce analytics, you’ll understand how your team is performing and what motivates them. Then, you can say goodbye to the struggles to keep your team in rhythm.
Interestingly, companies around the world now widely use it to measure and increase employee productivity.
Hence, in the article, I’ll share:
- Definition of workforce analytics
- Benefits of workforce analytics
- Practical examples of workforce analytics
- Who should use workforce analytics
- How to implement workforce analytics
So, let’s get started!
What is Workforce Analytics?
Workforce analytics, AKA workforce planning analytics, is a process that helps to inform and optimize company and HR decision-making. It uses employee data (attendance, performance, communication, learning, etc.) to make better decisions.
Let’s give you a practical example:
For instance, if your projects are taking longer than usual, your team members will barely concentrate. Even, you might lose some of your best performers.
You’ll be left wondering what’s happening. But you can get out of this loop if you follow these:
- Use data and statistical models to measure employee productivity.
- Focus on a broader perspective instead of on the people.
- Predictive analytics to forecast future workforce trends and outcomes.
Type of Workforce Analytics
There are 4 types of workforce analytics. Each has unique benefits for different businesses.
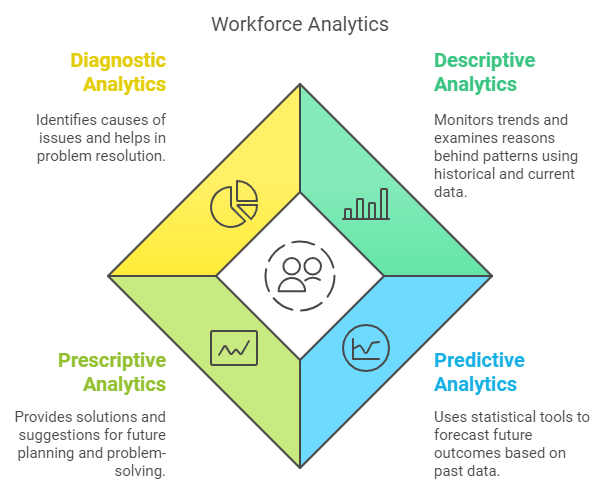
1. Descriptive Analytics
Descriptive workforce analytics monitors key trends and examines the reason behind any pattern. It works with both previous and current data to determine the trend or relationship.
This type of analytics helps HR and business owners make better decisions and address issues.
For example, it analyzes:
- How employees feel about their work.
- What people say when they leave the company.
- How well employees are doing in their jobs.
- Poor management or a lack of career growth.
2. Predictive Analytics
As the name says, it helps companies to predict future outcomes based on previous data. You can also make predictions based on descriptive analytics.
Predictive analytics needs tools like statistics, machine learning, and workforce analytics tools. It analyzes:
- When employees might leave the company using these analytics.
- How many new workers may join the company in the future.
- How many employees the company will need in the coming months or years.
- Lastly, it can predict more retirements in the next five years.
3. Prescriptive Analytics
Prescriptive analytics allows companies to find possible answers to their problems.
So, HR and employers can look at how past solutions worked and if they fixed the problems.
This analyzes:
- Whether you have the appropriate workers in the appropriate places when needed.
- It suggests different possible future situations to help plan ahead.
- It also suggests specific suggestions for managing employees better based on data and planning.
- Provides ideas on how to manage workers better
4. Diagnostic Analytics
Diagnostic analytics are linked to descriptive analytics because they both look at why this happened. It understands the cause and diagnostic analytics and helps companies fix problems and challenges.
After that, professionals use prescriptive analytics to advise companies on what steps to take to solve those problems.
This analyzes:
- How many employees are involved and happy with their work?
- Feedback from employees when they leave the company.
- Data on how well employees are doing their job.
Benefits of Workforce Analytics
There are so many benefits of workforce analytics and the benefits are long term. Both the employers and employees get benefits from it.
Here are some of the key benefits of workforce analytics on how it improves your team performance:
For Employers
Some of the key benefits employers can avail from utilizing workforce analytics.
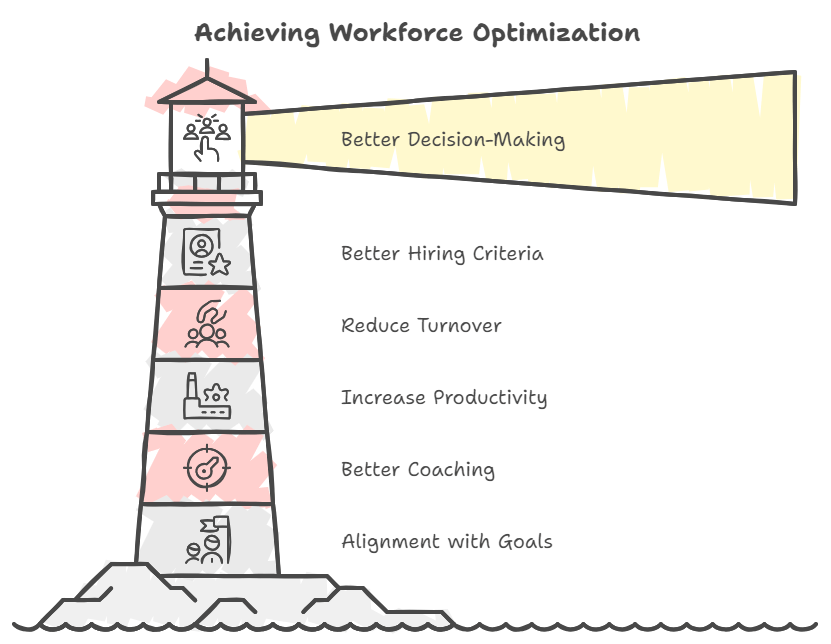
Better Decision-Making
Workforce analytics helps employers to make better decisions. You will have data, performance metrics, engagement levels, and skills gaps to make an informed decision, not just a guess.
You’ll start making smarter, more objective choices and put the right people in the right roles. It saves you from the headache of trial and error, and your team thrives as a result.
Better Hiring Criteria
If you are an HR person, you know the struggle of hiring the perfect candidate. The constant shifting from resumes, having interviews, and still end up with the wrong fit. Pretty annoying, right?
Workforce analytics help you to hire the potential candidates, experience, and characteristics of your top-performing employees. It analyzes the top performers and makes predictions based on their metrics.
Further Read: Hiring Remote Teams - Know These Essential Things While Planning
Reduce Employee Turnover and Costs
High turnover is a pain. It costs our valuable resources, time, and employee morale.
But with workforce analytics, you can spot patterns in why employees leave—maybe it’s compensation or work-life balance.
Once you know the root causes, it becomes easier to take action. It reduces turnover, saves on recruitment and training costs, and builds a more loyal, engaged workforce.
For Employees
Some of the advantages employees can avail by properly applying workforce analytics.
Increase Employee Productivity
Statistics say employees can only be productive for 60% of the day. With workforce analytics, you can see patterns in your work habits and productivity. It collects data and analyzes them to visualize the pattern of your work.
Maybe you’re most focused in the mornings, or specific tasks take longer than expected. When you know your strengths and weaknesses, you can maximize your productivity.
Further Read: 11 Ways to Increase Employee Productivity
Better Coaching from Your Manager
If your manager gives you data-driven feedback that highlights your strengths and areas for improvement, it becomes easier to understand.
This helps you see where you excel and where you might need to grow.
Moreover, your manager can see exactly where you might need a little extra support. So your improvements become more targeted and relevant.
Alignment with Company Goals
How great does it feel when your professional goals are aligned with the company’s mission?
Workforce analytics provides a clear view of how your individual contributions fit into the broader company objectives. When you see how your work impacts you, it becomes easier to stay motivated and engaged.
Practical Examples of Workforce Analytics
If workforce analytics still feels a bit confusing, let me share a few practical examples to make it clear:
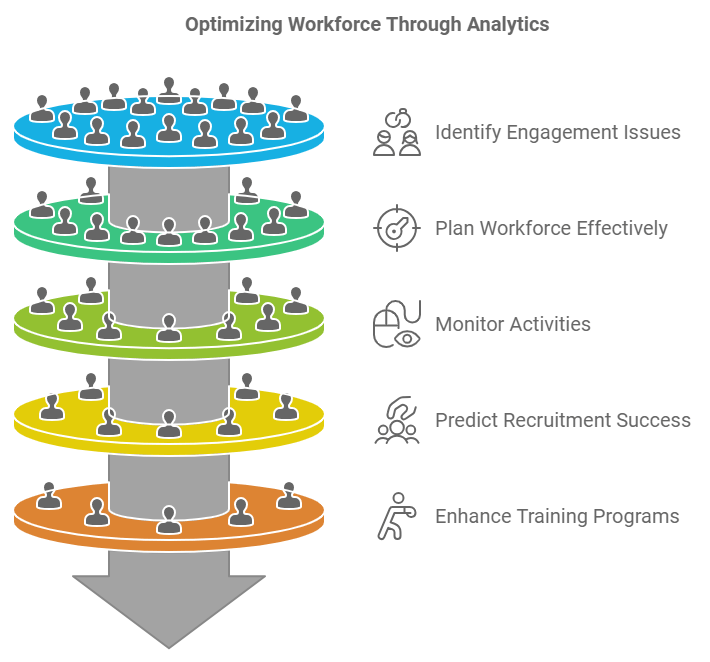
Improving Employee Engagement
Reports say only 20% of the employees are engaged in their work. But what’s the reason?
Workforce analytics helps you understand employee engagement with data-driven insights. There are many ways to bring this in action. For example, using an employee turnover calculator can provide valuable data on retention rates and help identify areas for improvement.
Patterns like absenteeism, more sick leaves, or a decline in performance help you identify the root cause of disengagement.
Effective Workforce Planning
Effective workforce planning means getting the right number of people with the right skills in the right place.
When you can do this well, it saves your company from costly last-minute hiring and reduces employee burnout.
Workforce analytics looks into employee data and predicts the future. That’s how you can ensure that your employees are in the right place.
Employee Activity Monitoring
Activity monitoring helps you understand how your team spends their time. It makes sure employees are using the resources wisely, completing the tasks on time, and no one feels pressured.
Tools like Apploye shows when your team is most productive, and where time might be slipping through the cracks. This helps you see when employees are most engaged and which tasks take longer than expected.
You may also like: Top 10 Best User Activity Monitoring Software
Recruitment Analytics
Workforce analytics can predict which candidates are most likely to be suitable for your role. It helps you make informed decisions.
Thus, it reduces turnover and improves long-term results. Moreover, it also saves time and resources, so you don’t need to go through the same hiring process again.
Employee Training
Workforce analytics can show you areas that need improvement or what training would make the employees more efficient. It tracks performance, measures the impact of past training, and even predicts future trends.
So, training becomes more focused and effective. Companies can arrange programs for specific teams or individuals for specific issues.
Workforce Analytics Metrics to Track
If you track specific workforce analytics metrics, you will get to know your employee well-being.
These are some most important workforce analytics metrics to track for better output from your employees:
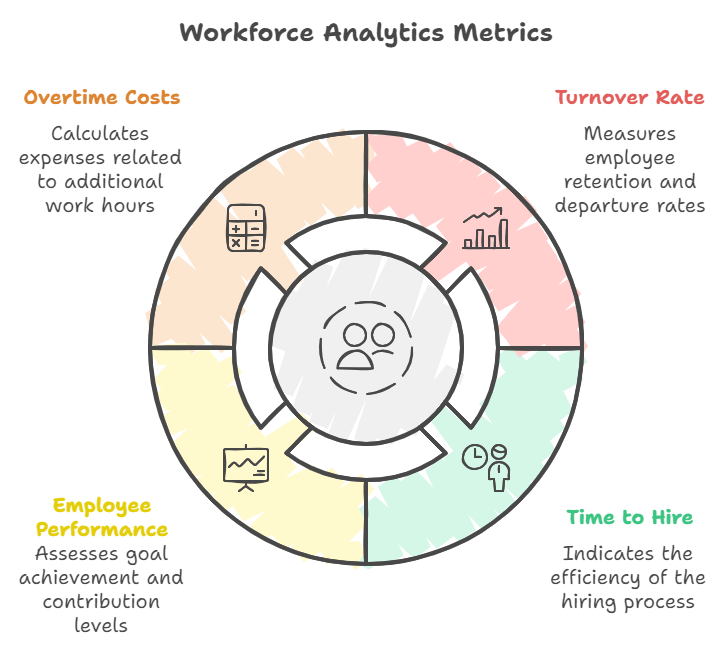
Turnover rate
The average turnover rate for any industry is about 20%. Hence, it’s one of the most important metrics in workforce analytics and shows the percentage of employees leaving your company.
The formula for measuring turnover rate is,
Turnover rate = (Number of employees leaving/Total headcount)*100
For example, you work for a company that has 500 employees. Over the course of a year, 50 employees decide to leave the company.
Turnover rate = (50 ÷ 500) × 100 = 10%
Time to Hire New Employee
It shows you the average time of when to hire new employees.
To find the average time to hire, add the days it took to hire each person. Then, divide that by the number of people you hired.
So the formula is,
Time to Hire = (Total Hiring Days/Number of Hires)
For example, your team gets a job opening on Day 1 and makes an offer on Day 25. The candidate applied on Day 10, so your time to hire is:
Time to Hire = 25 - 10 = 15 days.
Now, let’s say you filled three roles with times to hire of 15, 20, and 40 days. To find your average time to hire:
Average Time to Hire = (15 + 20 + 40) / 3 = 25 days.
This shows your team takes an average of 25 days to hire across roles.
Employee Performance & Satisfaction
Employee performance shows how well employees meet their goals, contribute to the team, and align with the company's objectives.
And, often we forget to measure employee satisfaction, but it is as important as other metrics too.
You can arrange for a survey or questionnaire to determine what your employees feel about their jobs. It may include other aspects like, their compensation, work-life balance, effectiveness, and job security, etc.
Overtime Costs
The overtime rate is usually 1.5 times the regular hourly pay. Some places may have different rates for certain situations. For example, double time (2 times) might apply on holidays or when you work too many hours.
The formula to calculate the overtime cost is,
Overtime expenses = Total overtime hours worked x Overtime pay rate
If an employee worked 10 overtime hours at $20/hour, the overtime expenses would be:
10 × $20 = $200
So, the company would pay $200 for overtime to that employee.
Who Should Use Workforce Analytics?
Workforce analytics has so many benefits, and employees, managers, and executives widely use it. Here’s a list of people who should use workforce analytics:
HR Managers
HR managers can use workforce analytics to monitor employee productivity and the company's overall trend. It lets them analyze employee performance, turnover rates, and engagement scores.
Moreover, they can identify high-potential employees and those who need attention.
Employees
As an employee, you may feel overwhelmed by endless calls, messages, and meetings that seem never to end.
Workforce analytics helps you identify patterns in your work habits. It analyzes your time, when you’re most productive, and when you need breaks.
CEOs
Most CEOs' constant concern is for their company's efficiency and productivity. Workforce analytics lets them know what’s going on and what precautions they might need to take.
It also makes the hiring process easier and less stressful. Moreover, he can anticipate future trends and make data-driven decisions based on them.
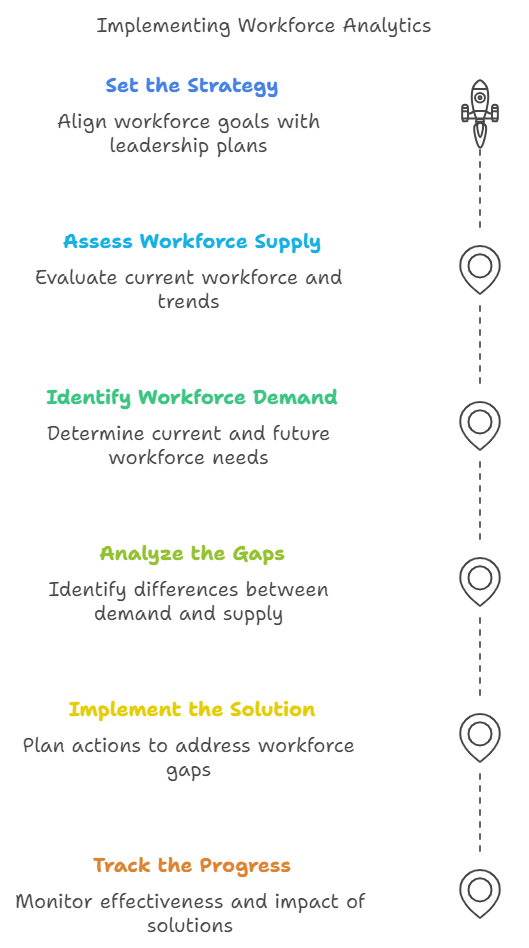
What are the Steps to Introduce Workforce Analytics in Your Business?
These are the steps to introduce workforce analytics in your business:
- Set the Strategy: Firstly, you need to know the main goals and future plans of the leaders. Then align the workforce to help reach these goals.
- Assess Workforce Supply: Check out the current workforce. See how it might change over time due to turnover and other trends.
- Identify Workforce Demand: Understand what the organization needs now and in the future for its workforce.
- Analyze the Gaps: Find the differences between workforce demand and supply. Focus on the most important gaps that affect performance.
- Implement the Solution: Plan actions to fill the gaps in the workforce. It will help the organization meet its strategic goals.
- Track the Progress: Check out if the solutions work for your business. Also, see their impact on the gaps and keep improving them for better results.
How to Implement Workforce Analytics
Here is a step-by-step guide on how you can implement workforce analytics:
Step 1: Define Your Goal
First, focus on your goals. Are you looking to improve employee retention, increase productivity, or understand skills gaps?
Also, don’t forget to analyze your current skills and how to use them more effectively.
Step 2: Gather Your Data
Next up is data collection. You’ll need to gather data from various sources—employee surveys, performance reviews, attendance records, and more. Make sure you’re collecting both quantitative and qualitative data.
Step 3: Analyze the Data
Now it’s time to analyze the data you collected. Look for patterns and trends in the data using various HR analytics software. Are there specific times when employee engagement dips? Do certain teams perform better than others?
Step 4: Interpret with the Right Tool
Once you’ve analyzed the data, it’s essential to interpret those findings. What does the data interpret?
Share these findings with your team in an easy way to understand. Tools like time tracking, and productivity can show you employee performance and efficiency.
Similar Read: 30+ Best Productivity Tools for Remote Teams
Step 5: Take Action
This is the final and most important step. Based on your data, take strategies to address the challenges or opportunities you’ve identified.
It can be implementing new training programs or increasing the right tools in the company.
Best Practices for Using Workforce Analytics
To get the best from workforce analytics, these are some of the best practices you must follow:
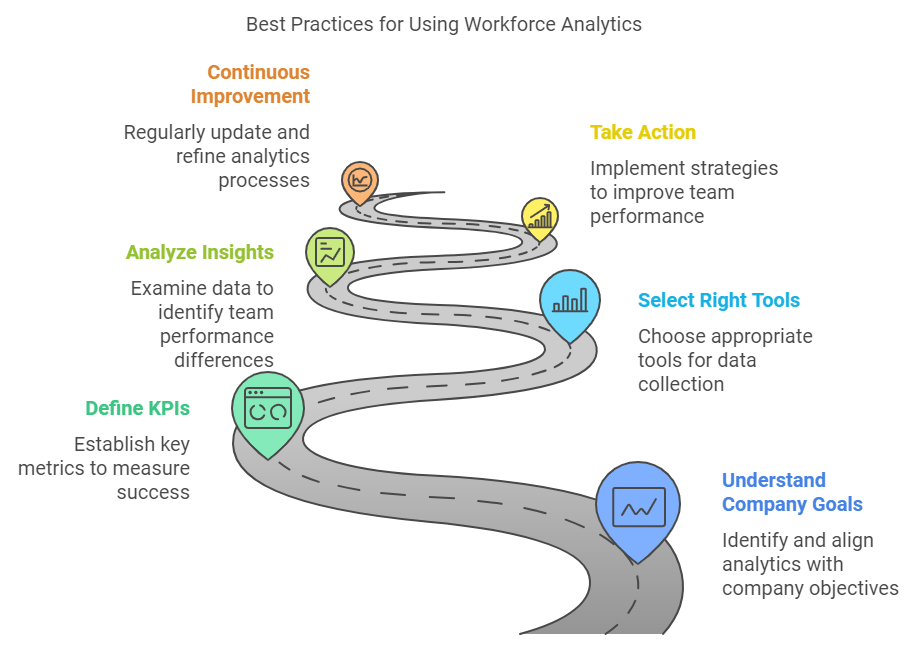
Understand you Goals
By now, we know how beneficial workforce analytics can be. But this only works well when used according to your company’s goals and needs.
First, you need to understand your company's goals, both short-term and long-term. When you know where you want your company to be, it becomes easier to work on that.
Define your KPIs
Identifying the key metrics you want to measure and working on them is equally important. Or else, it would be a real hassle for you thriving to get the best from your team.
Select the Right Tools
Now that you have identified your goals and KPIs, the next task is selecting the right tool. If not selected the appropriate tool, all work will go in vain.
So, how do you get started?
First, think about the kind of data that would be most beneficial. You could look at metrics like employee turnover rates, performance reviews, or even feedback from surveys.
Try our advanced time tracking tool Apploye
Analyze and Action on Insights
You might find that certain teams are thriving while others are struggling. Maybe your sales team is hitting targets, but your customer service team feels overwhelmed.
Now it’s your chance to act! When you are proactive, you not only improve performance but also increase morale.
Continuous Improvement
Remember that workforce analytics isn’t a one-time effort. It’s a continuous cycle. Don’t forget to monitor and leave room for improvement. This will help you adapt to changing needs and align your team with your goals.
Conclusion
Imagine how great it feels to no longer depend on your thoughts and gut feelings when making decisions. You can just look into the data and make decisions based on it.
Workforce analytics has made it easier for the business to reach their goals in a short time. It not only increases the performance of the employee but also the workforce as a whole.
FAQs
1. What does a workforce analyst do?
Workforce analysts study and understand workforce data. They find ways on how the teams work. The goal is to reduce costs while improving customer satisfaction and experience.
2. What is the difference between workforce analyst and data analyst?
Workforce and data analysts both work with data, but they focus on different areas. A workforce analyst looks at workforce data to understand employee behavior, labor trends, and talent management. Whereas, a data analyst, works with data from many departments to shape business strategies.
3. How do you do a workforce analysis?
These are the steps on how to do workforce analysis:
- Start by gathering data like age, job roles, and time at the company.
- Look for patterns, trends, and issues in the data.
- Focus on skill gaps, training needs, and future leadership planning.
- Make strategic decisions and create a plan to fix any problems.
4. What are the 4 key pieces of workforce management?
The 4 key pieces of workforce management:
- Workforce planning: Understand what the company needs and predict future staffing.
- Workforce scheduling: Make employee schedules to ensure enough coverage and reduce overtime.
- Time and attendance management: Keep track of work hours, absences, and lateness.
- Labor analytics: Study workforce data to spot trends and improve scheduling.
5. What is the difference between workforce analytics, hr analytics, and people analytics?
Workforce analytics focuses on how to plan the workforce, improve talent, and make things work better. HR analytics looks at things like hiring, keeping employees, and happiness.
People analytics includes both workforce and HR analytics. It looks at how individuals perform and behave, and how well the organization is doing overall.
Continue Reading:
About Author