Using Time Tracking Data for Capacity Forecasting (3-Step Guide)

Key Takeaways
-

When you log real working hours per project type, it gives you a capacity baseline based on what your team does.
-
To build the forecast, calculate your real baseline, compare planned hours to actuals, and then model seasonal demand changes using patterns in your historical data.
-
When logged hours don’t match real output, the starting capacity ceiling becomes too high.
You said yes to a project because the headcount looked fine. Three weeks in, your top person is stretched. Plus, you’re missing the deadline. Even worse, nobody saw it coming.
Well, it happened because you made the schedule based on your team members' availability. No worries, I’ve made this write-up to fix things up.
I’ll share with you the ways of using time tracking data for capacity forecasting. You’ll see how to find your team's true working hours and why your time estimates are often too low. Most importantly, how to match your next project to your team's real capacity.
How Does Time Tracking Data Support Capacity Forecasting?
You can see —
- How long tasks actually take
- Where hours go beyond project work
- How much focused output can your team realistically deliver per week
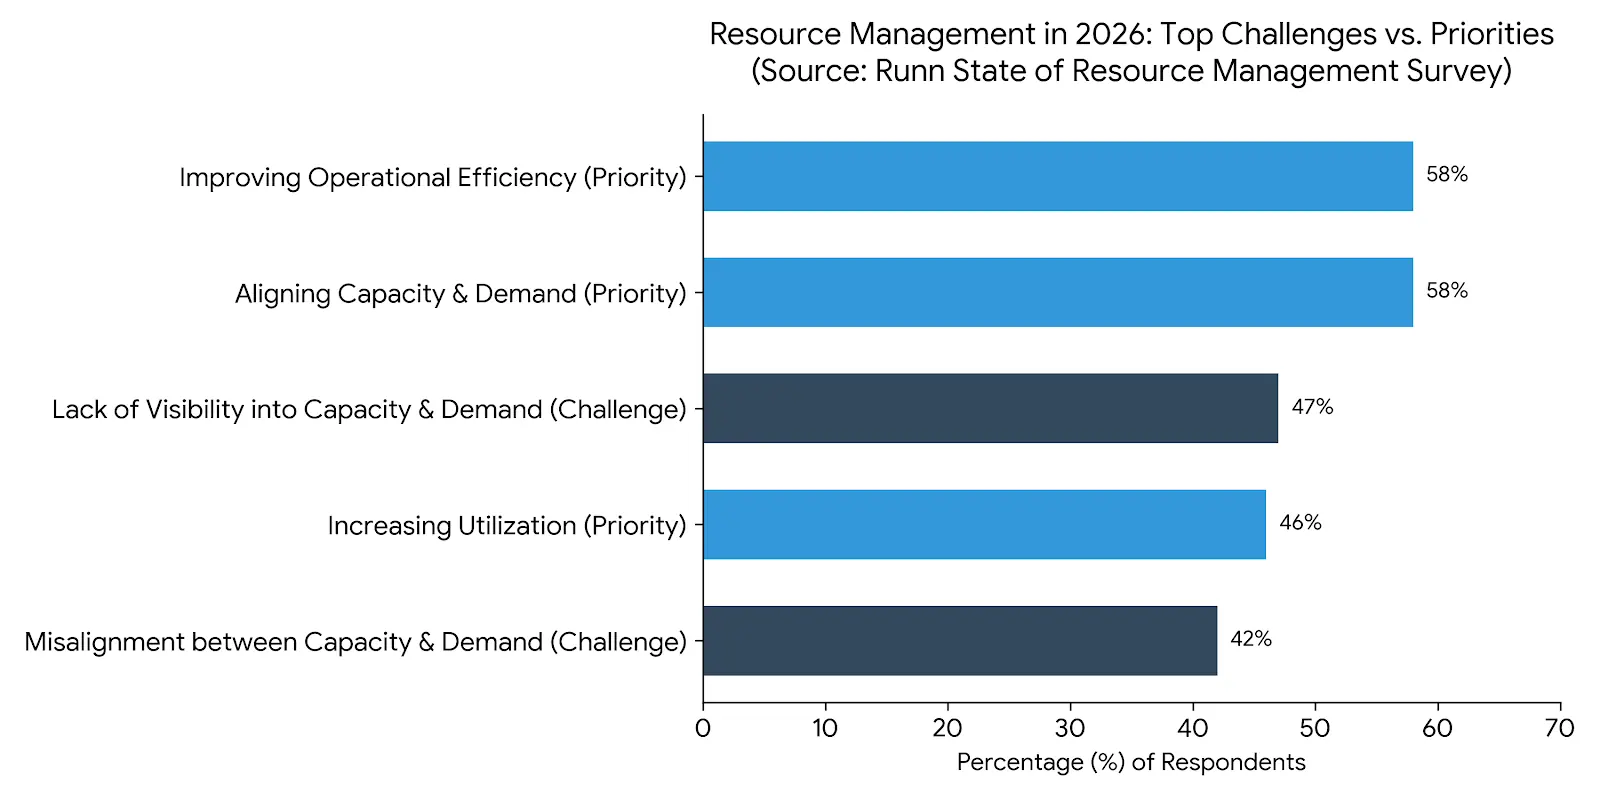
According to The State of Resource Management in 2026, 86% of organizations now do capacity forecasting on a regular or occasional basis. That is a rise from 81% in 2025.
However, most teams approach workforce capacity planning as a headcount exercise. They count seats, assume eight-hour days, and plan from there. Yet that number never matches what actually happens.
Right there, time tracking software logs replace that assumption with real-time data.
3 Steps to Turn Your Time Data Into a Capacity Forecast
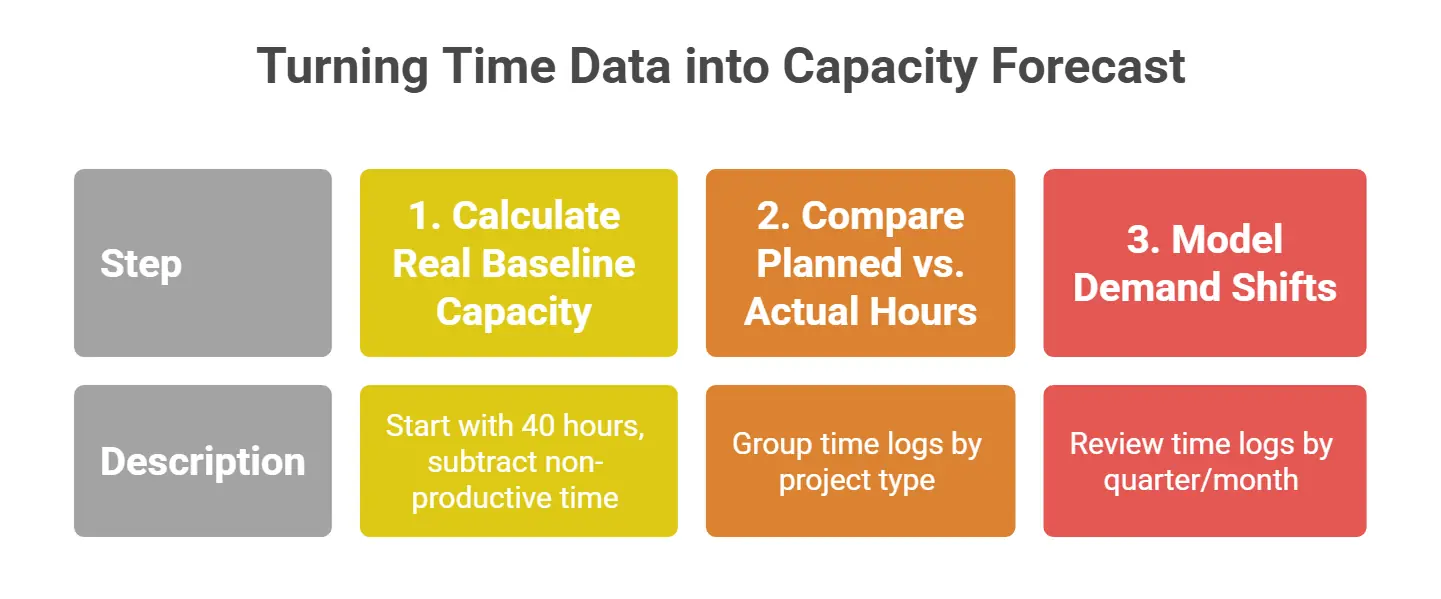
These three steps take you from raw logs to a capacity planner number you can plan and hire from.
1. Calculate Your Team's Real Baseline Capacity
Start with a 40-hour workweek. In my case, I —
- Subtract recurring meetings
- Admin work
- Internal communication
Most teams land between 30 and 35 available hours per person. That figure is your starting baseline.
But remember, available hours and productive hours aren’t the same. Idle time, context switching, and low-output stretches reduce what you truly finish. Most forecasts go wrong right there.
Track your team's real productive hours for free
2. Compare Planned Hours to Actuals Per Project Type
Pull historical time logs from your project tracking records. Then, group them by project type or deliverable category. Also, compare the initial estimate for each task against what was actually logged.
Some task types consistently run over. Others come in under. That said, once you find a variance, quantify it.
- If a deliverable type runs 25% longer than planned, apply a 1.25x multiplier to every future estimate for that type. That adjustment removes optimism bias from your project planning.
- Again, if you project time estimation correctly at the beginning, you will have fewer corrections later on.
3. Model Demand Shifts From Seasonal Patterns
Time logs show when the workload spikes and when it drops. So, review your data by quarter or month. In return, you can build seasonal forecasts with confidence. For instance, Q4 customer requests surge while summer often slows.
Now, use those patterns to run what-if scenarios with supply and demand in mind.
- When employee attrition hits, quantify exactly how many hours disappear from the active pool.
- When a major client comes in, know which project types absorb the load first.
When you get real historical data, it gives your forecast a solid range.
How Apploye Closes the Gap Between Time Logged and Capacity Available
Most often, your capacity forecast is only accurate on the day you build it. See, your workload management patterns as well as the team behavior changes. Also, the data becomes outdated. As a result, your plan falls apart before anyone notices.
Right there, Apploye gives you two data layers to keep a forecast updated.
- Its time tracking reports show actual hours logged per project, per person, and per task type. You can run variance checks at any point and adjust multipliers as real patterns change.
- Meanwhile, the productivity monitoring shows you how much of that logged time is active output. Hence, your capacity ceiling stays grounded in what your team actually delivers.
Together, they give you a forecast based on a real utilization rate.
Wrapping Up
Using time tracking data for capacity forecasting works when you have real data. If you have three months of structured logs, start with the baseline calculation. If not, get your time tracking consistent first.
Frequently Asked Questions
What time tracking data do you need before building a capacity forecast?
For capacity forecasting, you need at least 3 months of logged hours grouped by project type and task category. That window gives you enough variance data to spot which task types consistently run over. Hence, you can adjust your estimates before the next project starts.
What is a capacity buffer, and why does it matter?
A capacity buffer is the share of team capacity you hold back from project allocation to cover unplanned work, revisions, and overhead. Most teams target 70 to 80% utilization and leave 20 to 30% as the buffer. Without it, any unexpected request pushes the team into overload.
How is capacity forecasting different from resource planning?
Capacity forecasting predicts how much work your team can handle over a set period. On the other hand, resource planning allocates specific people to specific tasks. Forecasting comes first. It tells you whether you have the capacity before you start assigning who does what.
How often should you update a capacity forecast?
Update your capacity forecast monthly at a minimum, or after any significant team or project change. Also, conduct monthly reviews to catch variance trends before they compound. A new hire, a departure, or a scope shift on a major project each requires an immediate update.
About Author