12 Standard Call Center Metrics and KPIs to Measure Performance
Key Takeaways
-

Call centers track two distinct things: activity through metrics and business progress through KPIs.
-
Customer experience KPIs, such as CSAT, FCR, NPS, and CES, measure how customers feel and whether their issues were solved.
-
Agent performance metrics, like AHT, utilization rate, schedule adherence, and ACW, measure how well your team uses its time.
-
Operational metrics, like service level, ASA, abandonment rate, and cost per call, evaluate how the contact center runs at scale.
Most teams track everything and act on nothing. The real issue is knowing which ones signal a genuine problem and which ones just fill a dashboard.
Today, I’ll walk you through the standard call center metrics and KPIs to measure performance. You’ll learn what each benchmark looks like and how to read the numbers before they turn into problems.
What are Call Center Metrics and KPIs?
Metrics give you a full picture of what’s happening inside your contact center. KPIs tell you whether what is happening is moving the business in the right direction.
For example, call volume is a metric. And First Contact Resolution rate linked to a customer satisfaction target is a KPI.
The 12 Core Call Center KPIs Every Manager Should Track
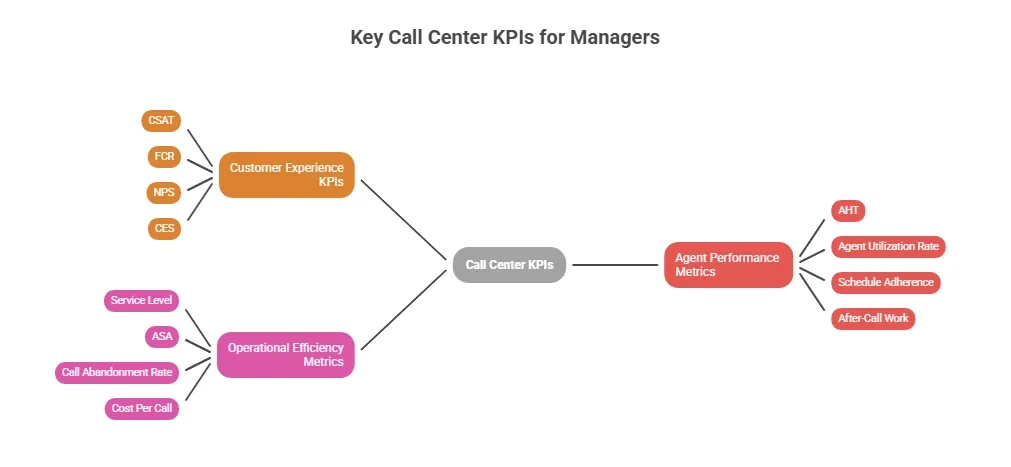
The KPIs below fall into three clusters. They’re customer experience, agent performance, and operational efficiency. Each one measures a different layer of your call center's actual performance.
Customer Experience KPIs
These KPIs measure how customers experience your support. They go beyond speed and volume to capture satisfaction, loyalty, and the effort customers put in to get help.
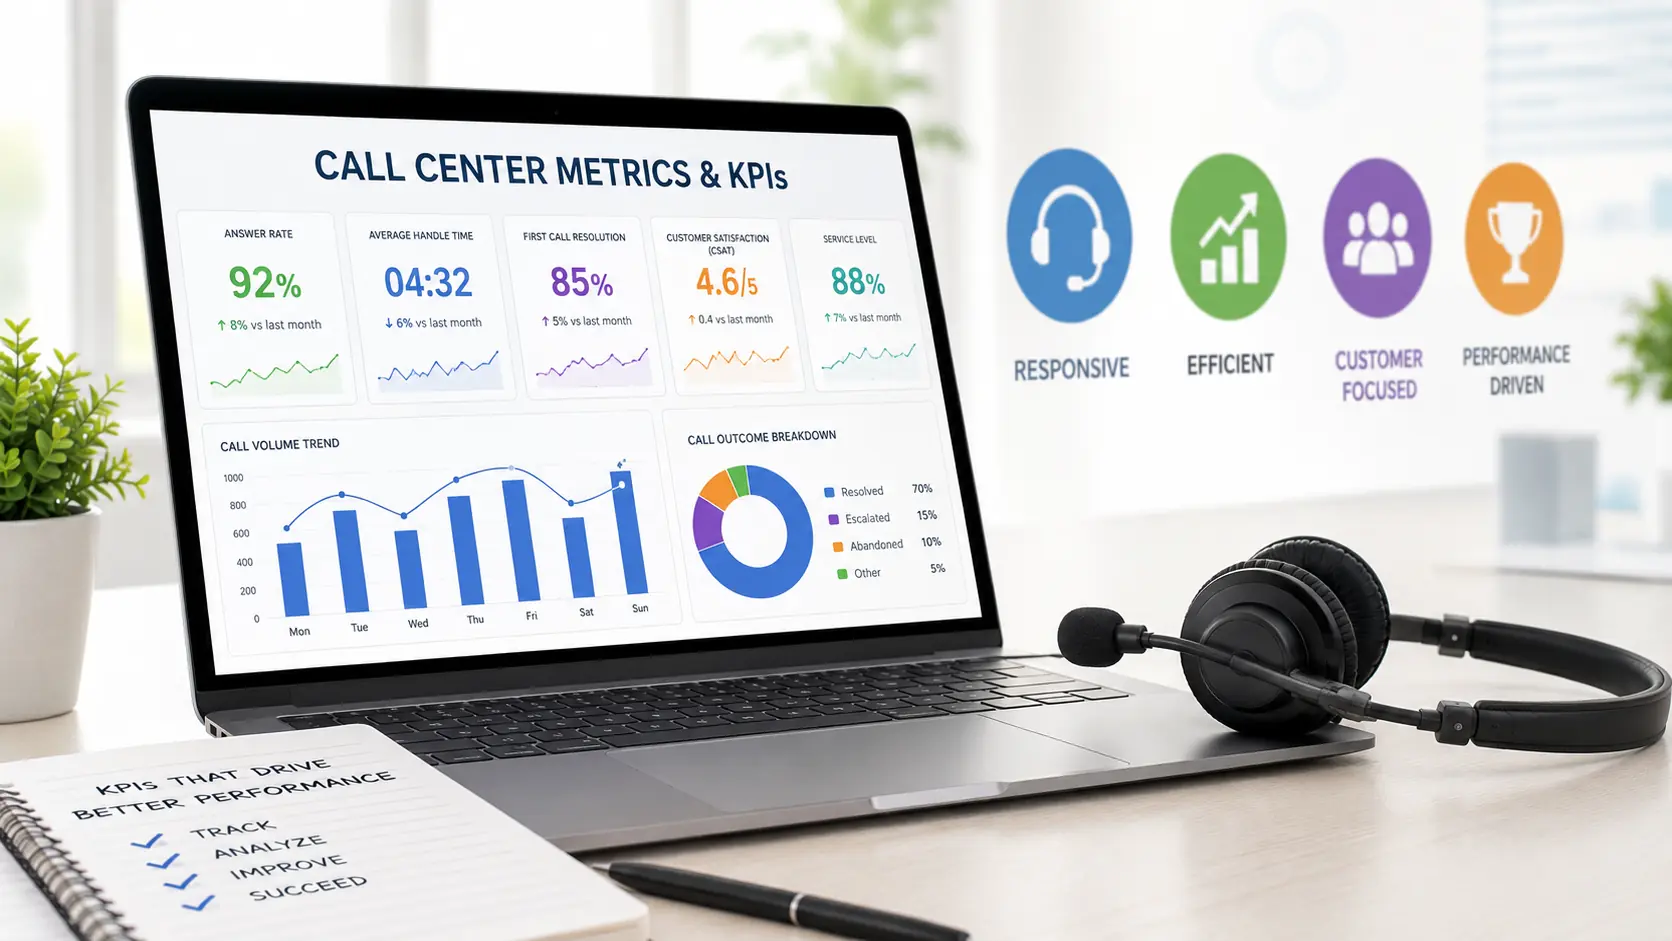
1. CSAT (Customer Satisfaction Scores)
Customers rate their experience on a 1 to 5 scale. The score is the percentage of respondents who chose 4 or 5.
A high score means that your agents achieve strong first contact resolution. Meanwhile, a low score points to friction, like —
- Unresolved issues
- Unnecessary transfers
- Training gaps in your contact center
You should know that Salesforce reports that the average CSAT is around 78%.
2. FCR (First Call Resolution)
Every unresolved call generates follow-up contacts. Hence, that inflates —
- Call volume
- Raise cost per call
- Pull customer satisfaction scores down at the same time
According to SQM Group, the industry benchmark sits between 70% and 85%. Below 70% first contact resolution signals —
- Gaps in agent training
- Routing accuracy
- The knowledge resources agents can access mid-call
3. NPS (Net Promoter Score)
Customers respond on a 0 to 10 scale.
- Scores of 9 to 10 are Promoters.
- Scores of 0 to 6 are Detractors.
Moreover, NPS is the Promoter percentage minus the Detractor percentage.
While customer satisfaction measures a single interaction, NPS measures the overall relationship. A customer can rate one call positively and still not recommend your brand. That gap is exactly what NPS tracks.
4. CES (Customer Effort Score)
High effort experiences accelerate customer churn rate. On the other hand, a high call transfer rate, long hold times, and a poorly configured IVR system all push the score up.
Servion found that only 9% of customers with low effort leave a brand, compared to 96% with high effort. CES pairs with CSAT and NPS to give managers a complete read on the customer journey.
Agent Performance Metrics
The following standard call center metrics and KPIs to measure performance show how your team handles the work between queue and resolution.
5. AHT (Average Handle Time)
It covers —
- Talk time
- Hold time
- After-call work
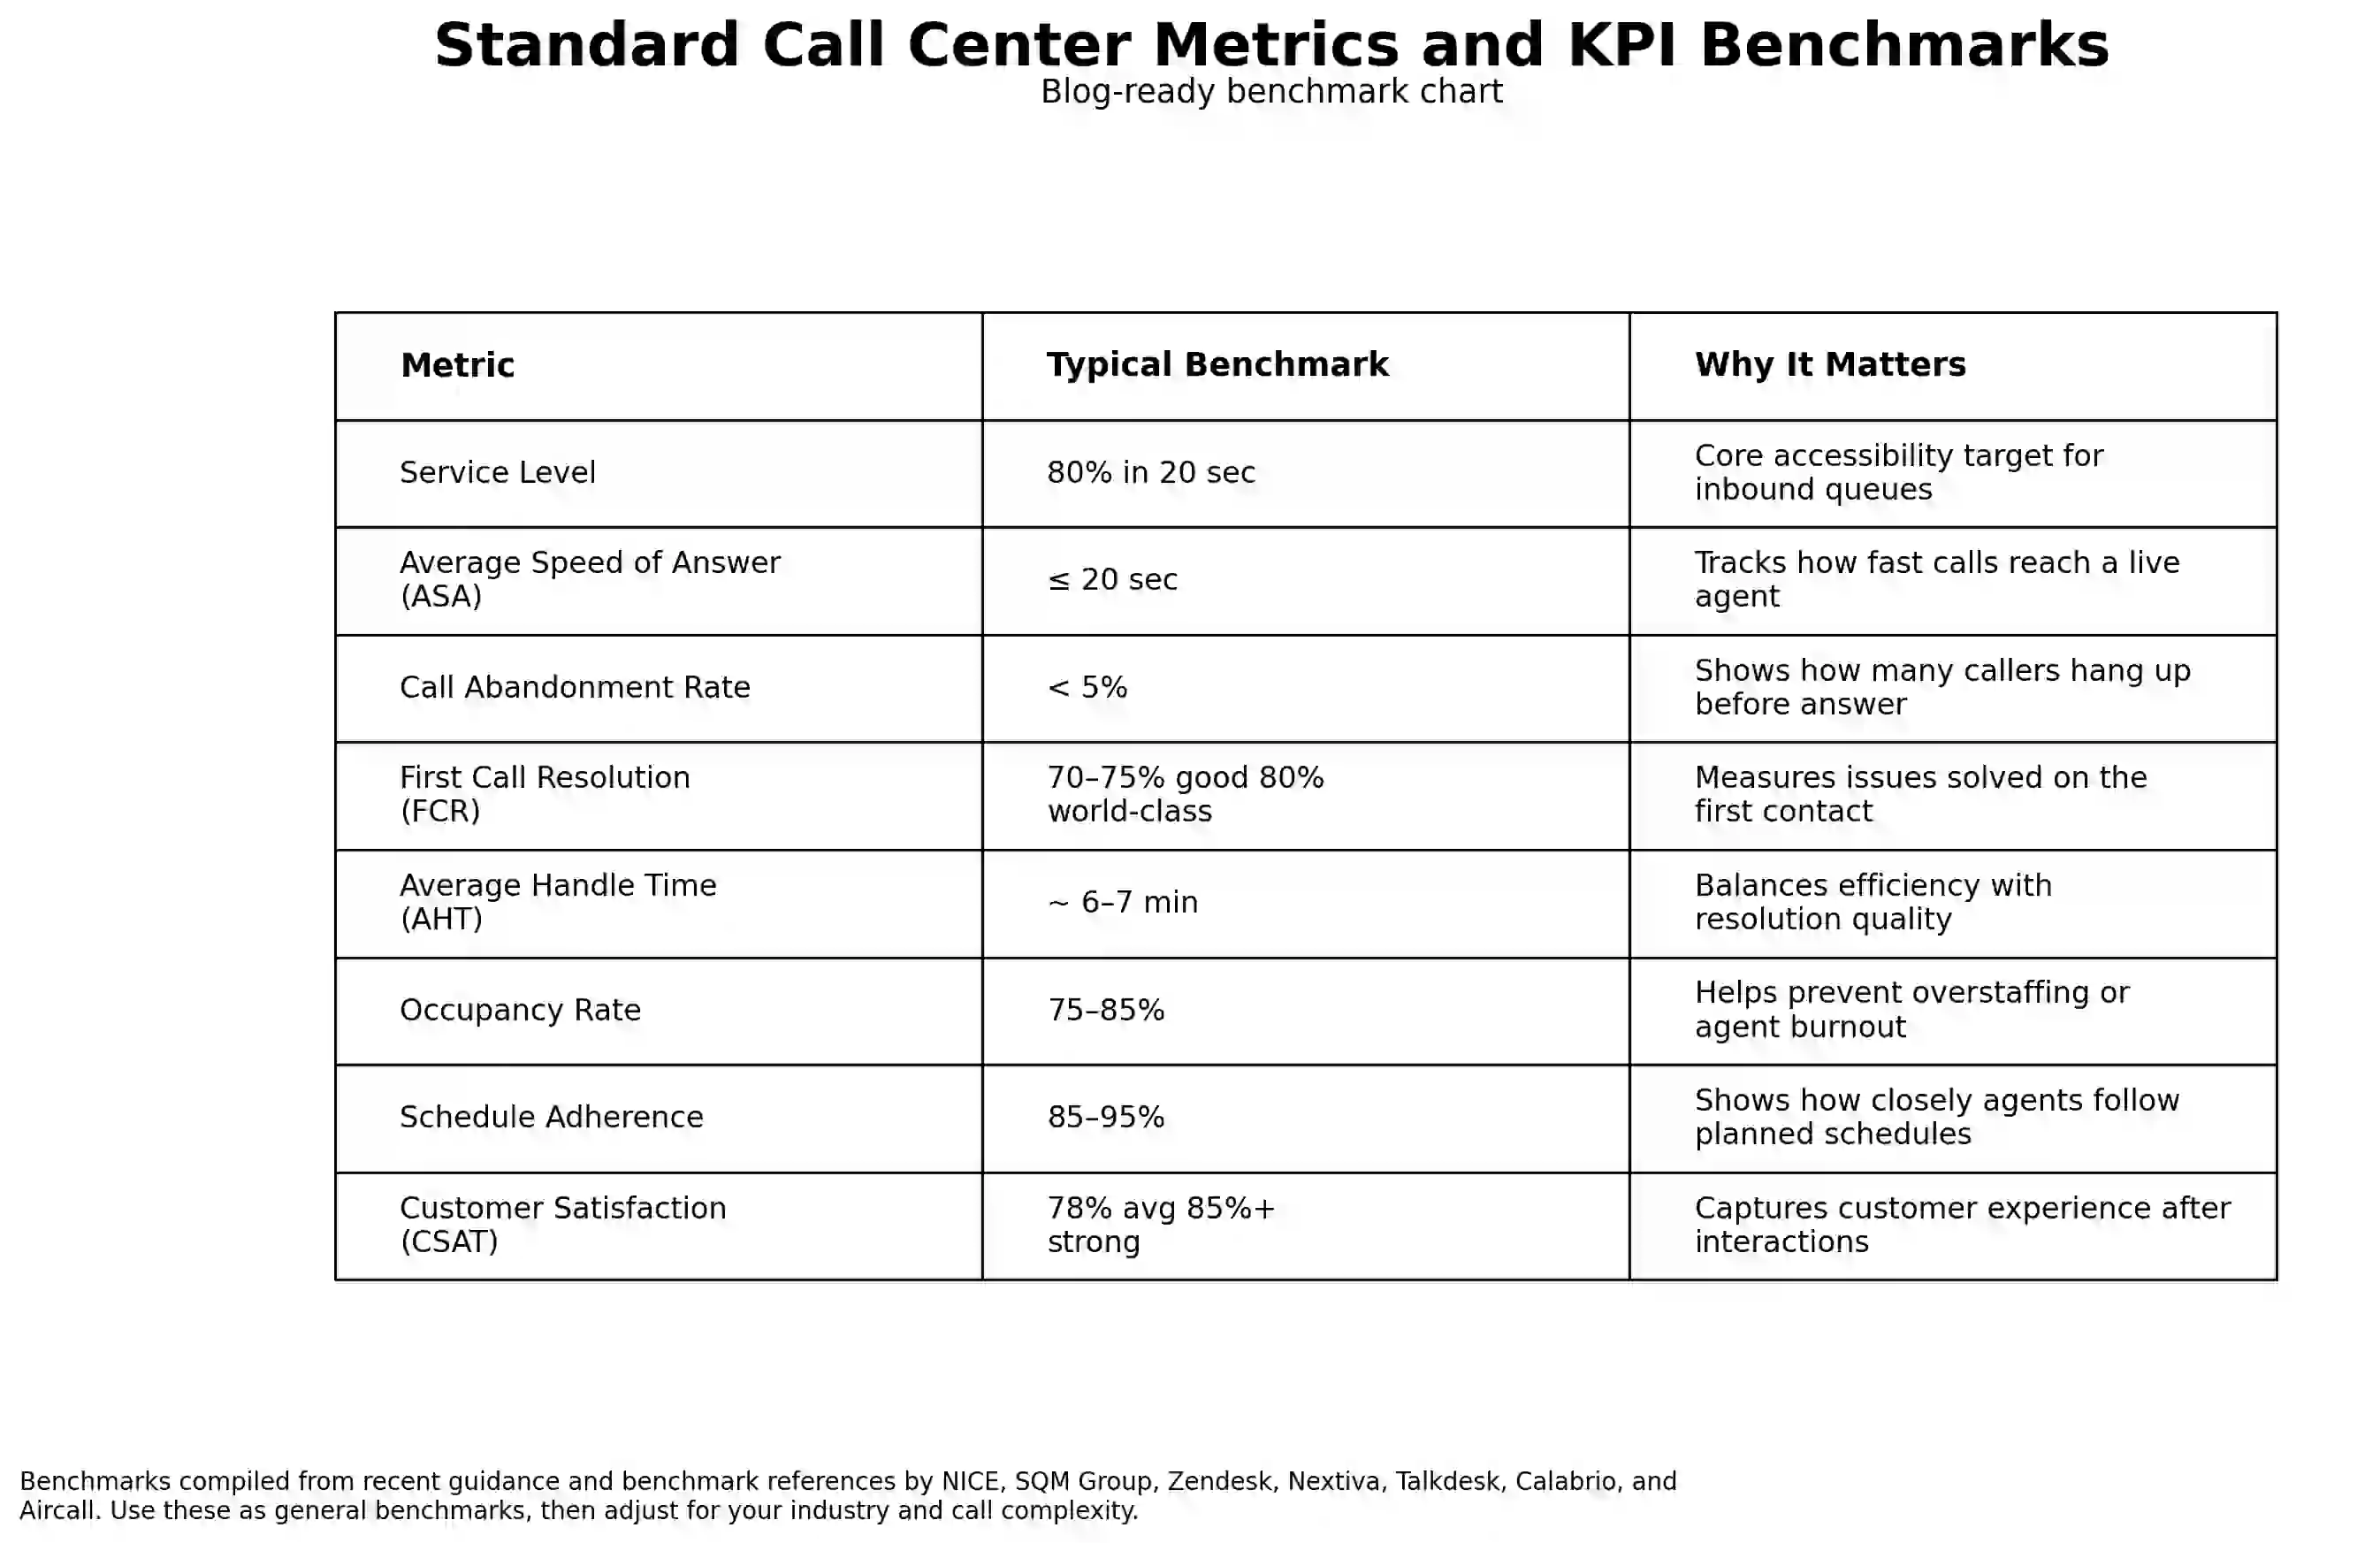
The benchmark for general voice queues sits between 4 and 7 minutes. But complex or regulated environments run longer.
Remember, long hold times point to system access issues. Meanwhile, a high average after-call work time, on the other hand, signals a documentation or tooling gap.
6. Agent Utilization Rate
It’s often confused with the agent occupancy rate, but the two measure different things
Occupancy counts handle time plus after-call work, while utilization looks at the full shift picture. The target range sits between 75% and 85%.
- Below 75% points to overstaffing or process inefficiency.
- Above 85% signals burnout risk.
Besides, agents without enough recovery time between calls make more errors and deliver lower quality interactions.
Learn more about
Understand & Improve Call Center Agent Utilization
7. Schedule Adherence
Low adherence creates coverage gaps at peak hours. Those gaps raise ASA and push the call abandonment rate up. Service level targets fall when agents are not where the schedule placed them.
Also remember, adherence data is only useful when you capture it in real.
8. After-Call Work (ACW)
It includes —
- Updating records
- Logging outcomes
- Scheduling follow-ups
High ACW directly cuts the agent occupancy rate. So, fewer agents are available for incoming calls during peak hours. It also signals a process problem. So, track ACW alongside AHT to get an accurate picture of where call time actually goes.
Apploye monitors agent time, idle periods, and tracks productivity data in real-time. It gives managers clear visibility. As a result, utilization rate, schedule adherence, and ACW numbers are accurate rather than estimated.
Track agent productivity in real time
Operational Efficiency Metrics
Operational metrics measure how well your call centers manage total call volume, speed, and cost at scale.
9. Service Level
The most common target is 80/20: 80% of calls answered within 20 seconds.
Falling below the target often signals —
- Understaffing and low agent occupancy rate
- A poorly configured IVR system
- Misaligned scheduling
But if your agents can consistently hit it, then your queue management and staffing levels match actual demand.
Service level should be read alongside the abandonment rate. When both are high, the problem is capacity. When the service level is low, but the abandonment rate is normal, the issue is routing or schedule adherence gaps.
10. ASA (Average Speed of Answer)
In fact, it directly shapes how a customer feels before the conversation even starts.
Long queue times lead to frustration. And agents then have to manage on top of the actual issue.
11. Call Abandonment Rate
Its benchmark sits between 3% and 8% after IVR filtering.
If you see above 10%, it’s a capacity problem. Most often call abandonment rate happens due to —
- Too few agents
- Poor call routing
- Peak hour coverage gaps
Abandonment rate and ASA move together. When ASA rises, callers lose patience and hang up.
12. Cost Per Call
The calculation divides total contact center costs by the total number of calls handled. The costs include —
- Agent wages
- Technology
- Facility overhead
- Training
For example, if your contact center spends $50,000 in a month and handles 2,500 calls, your cost per call is $20.
Your goal is a downward trend without a drop in service quality. Don’t try to cut costs by rushing agents. It only raises repeat call rates, which drives total cost back up.
Final Words
The standard call center metrics and KPIs to measure performance I’ve explained till now fall into three clusters for a reason. Customer experience, agent performance, and operational efficiency each measure a different failure point. If you track one cluster in isolation, you’ll miss what is driving the real problem.
However, agent performance metrics are only reliable when the time data underneath them is accurate.
Apploye gives call center managers real-time visibility. You can track agent hours, idle time, and productivity live. Hence, the numbers in your dashboard show what is actually happening on the floor.
Bring accuracy to your agent performance data
Frequently Asked Questions
What is the most important KPI in a call center?
FCR consistently ranks highest as it predicts customer loyalty. It also reduces repeat contacts and lowers operational costs simultaneously. Most benchmarks target 70 to 85% across general service lines.
What is the difference between call center metrics and KPIs?
Metrics measure specific activities, such as call volume, talk time, and hold time. KPIs measure progress toward a defined business goal. All KPIs are metrics, but a metric only becomes a KPI when it's tied to an outcome your team is accountable for.
What is a good first call resolution rate?
The industry benchmark sits between 70% and 79%. Healthcare averages 52%, with top performers aiming above 70%. The right target depends on your call complexity, industry, and customer expectations.
How does schedule adherence affect call center performance?
When agents don't follow their scheduled shifts, queue coverage drops during peak hours — raising ASA, abandonment rate, and customer frustration. A 5% drop in adherence can meaningfully shift your service level numbers.
Can time tracking software improve call center KPI accuracy?
Time tracking does three things. First, it records idle time. Second, it measures after-call work. Third, it tracks how well agents follow their shifts. This kind of detail shows what regular call center dashboards leave out. As a result, key metrics like utilization rate and schedule adherence start to reflect real agent work.
About Author