11 Proven Employee Engagement Metrics to Track

Summary:
-

Employee engagement metrics are proven strategies that organizations can use to track how effectively an employee is contributing to their team.
-
Employees who are engaged with their company culture turned out to be 23% higher profitable for the company. And companies that bring out frequent surveys tend to retain and develop better employee engagement.
-
Different metrics measured over time reveal patterns in employee behavior, motivation, and overall engagement and help businesses identify what’s working and what’s not.
-
Use employee net promoter score, turnover and retention rates, and absenteeism rates to track employee engagement, and they can be conducted weekly, monthly, and even annually.
According to Gallup employee engagement research, engaged employees show 18% productivity than those who are not engaged with the work culture.
When employees are truly engaged, they care about the company’s success. They take ownership, bring new ideas, and go the extra mile without being asked.
But to build that kind of culture, you need to measure what drives engagement in the first place.
In this blog, I am going to share the 11 proven employee engagement metrics that were nothing but a game-changer for our company.
So, let’s begin—
In this article
- Employee net promoter score (eNPS) engagement metrics
- Turnover and Retention strategy to measure engagement
- Pulse surveys for engagement tracking
- Diversity and Inclusive index strategy
Employee Engagement Metrics Every Manager Needs
1. Employee Net Promoter Score (eNPS)
Employee net promoter is one of the easiest employee engagement metrics companies tend to use. This metric is based on the system of measuring employees’ loyalty to their organizations by asking a few questions.
Here’s how to calculate eNPS:
- Ask employees one key question: “On a scale of 0–10, how likely are you to recommend this company as a place to work?”
- Divide response rates into groups:
- Promoters = 9–10
- Passives = 7–8
- Detractors = 0–6
- Apply the formula:
eNPS= %Promoters − %Detractors
2. Turnover and Retention Rates
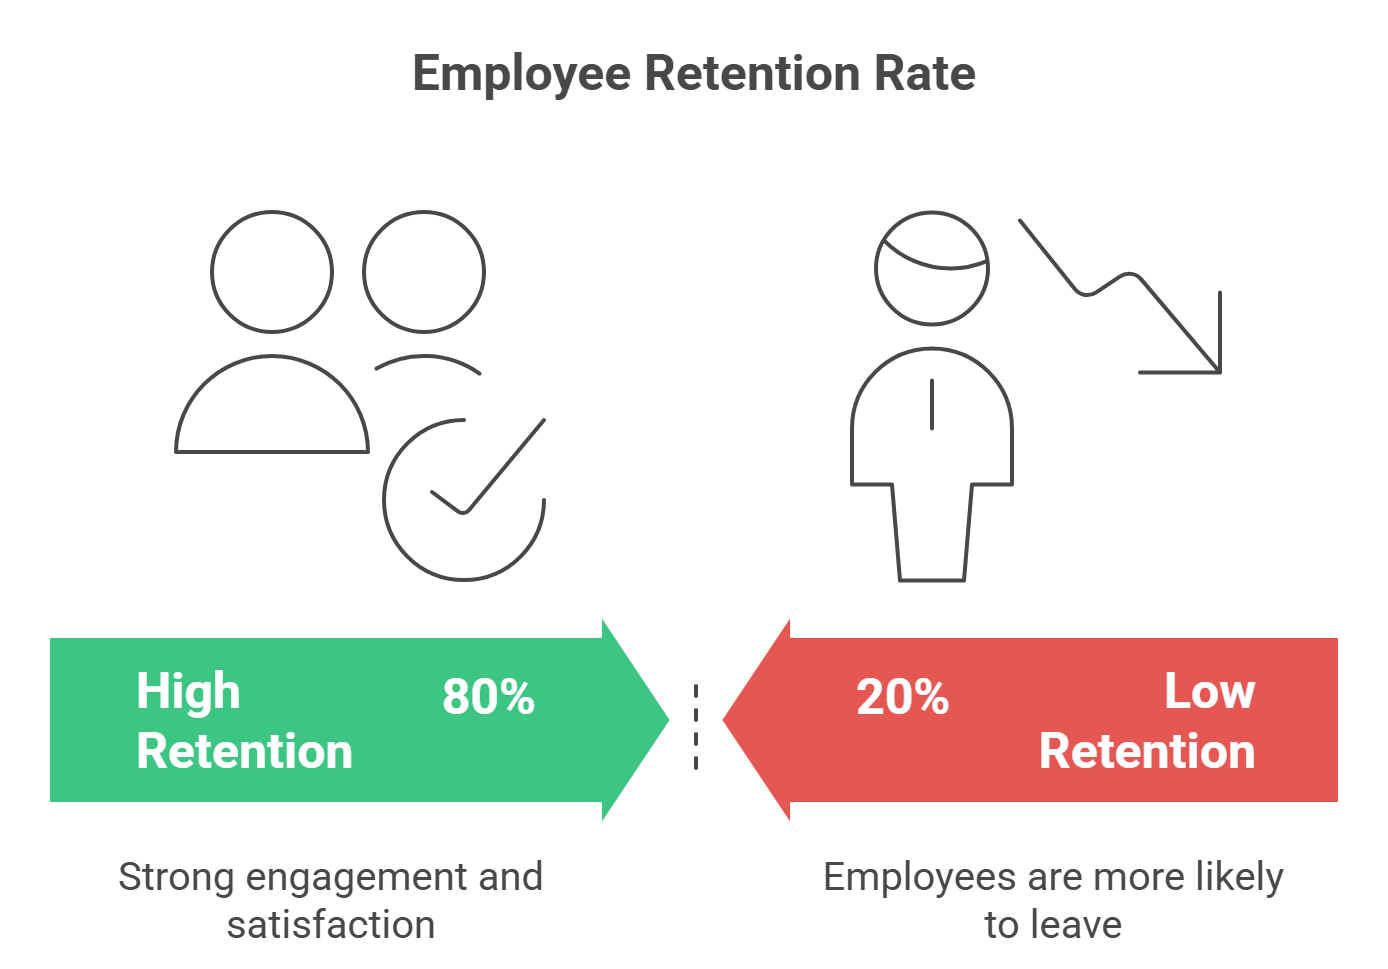
When employees are more likely to leave your company, it directly impacts your employee turnover rate.
Employees who feel supported and strongly connected to the team are less likely to leave. This is when a company has a lower turnover rate. The higher the employee turnover rate is, the more costly the challenges a company needs to face.
On the flip side, employee retention measures the number of people who stay with the organization over a period of time.
A high retention rate signals strong engagement and satisfaction. Besides, a stronger retention rate shows a team’s productivity and also saves the cost of new hiring and onboarding. Employees who understand your workflows and meet targets efficiently are more likely to stay.
By focusing on improving employee retention rate, you will invest in a more skilled, experienced, and cohesive workforce that ensures consistent revenue growth.
Here’s how to calculate employee Turnover and Retention rate:
- Turnover rate = (Number of employees who left ÷ Average number of employees) × 100
- Retention rate = 100 – Turnover rate
3. Employee Productivity Levels
Employee productivity levels metrics are one of the most effective ways to get insights about employee productivity. You can track employee performance easily. Instead of getting monthly or yearly data, it provides time-to-time data. It helps you to measure which project has been effective for different types of employees or what type of work is causing the most burnout.
There are two different ways to track employee productivity levels: 1. Manually, 2. Using tools.
Manual tracking gives employers a set of data indicating their employees' performance regarding projects.
On the other hand, using tools like Apploye productivity monitoring software gives detailed views with statistical data, including features like time tracking with screenshots, idle time tracking, user activity monitoring, app and website usage, and even automated reports for better decision-making.
Manually:
- Productivity = (Output ÷ Input)
- Example: Number of tasks completed ÷ Total hours worked
Using tools like Apploye:
- It can automatically track time spent on tasks and apps. So, it becomes easier to see where efforts are focused.
- Screenshots, activity levels, and task tracking give managers real-time insights without micromanaging.
- Reports can highlight trends, identify productivity dips, and help allocate resources efficiently.
Monitor productivity with automated tracking
4. Absenteeism Rates
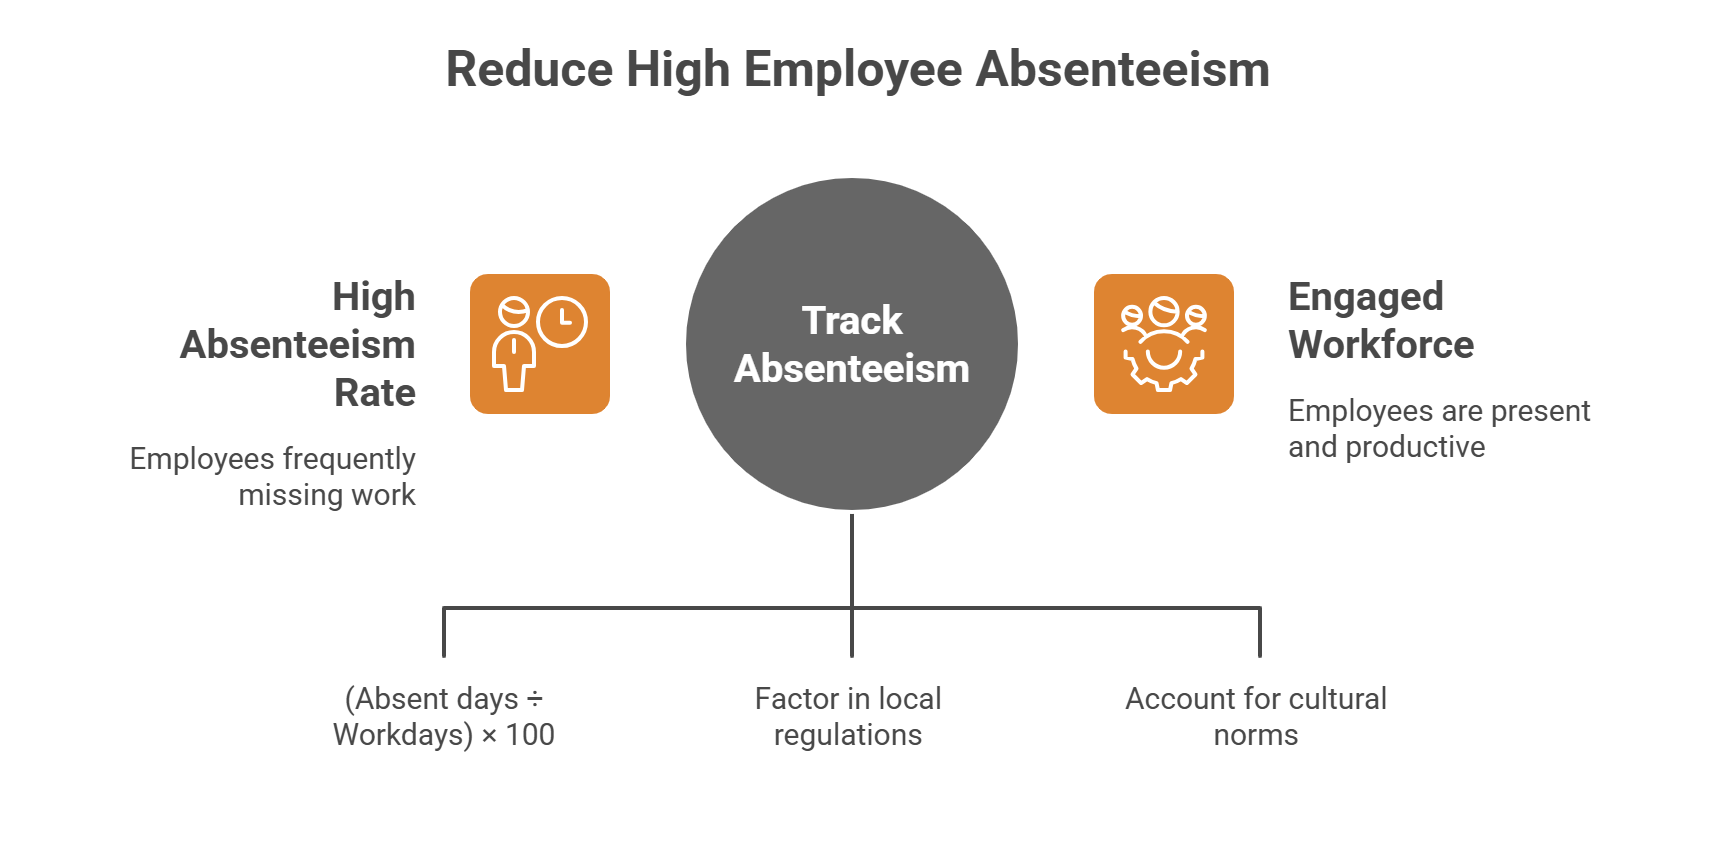
High absenteeism is often a red flag for deeper issues in the workplace. If employees are frequently absent, it might be a sign that they’re not engaged or satisfied with their jobs. Tracking absenteeism rates helps you understand what’s really going on behind the scenes.
How to calculate:
- Absenteeism rate = (Total absent days ÷ Total available workdays) × 100
It’s also worth noting that absenteeism looks different across the globe. Different countries have their own rules for sick leave and acceptable absences.
That’s why it’s important for you to factor in your local laws and cultural practices when you calculate absenteeism rates.
Track attendance & manage shifts seamlessly
5. Participation in Learning & Development
If your team stops learning, your company stops growing. That’s why tracking participation in learning and development (L&D) programs is such a strong engagement metric. When employees actively join training or skill-building sessions, it’s a clear sign they’re invested in their own growth and trust the company to support it.
How to calculate:
Turnover rate = (Number of employees who left ÷ Average number of employees) × 100
Retention rate = 100 – Turnover rate
6. Feedback & Survey Response Rates
If you want to know what’s working, you need people to actually respond.
Feedback and survey response rates show how open and engaged employees are when it comes to sharing opinions. A high response rate means people feel heard. Whereas a low response rate might signal distrust or survey fatigue.
Employee feedback also reflects how connected employees feel to leadership and how comfortable they are in giving honest feedback. Therefore, it is considered one of the most effective methods for improving a company's culture and engagement system.
7. Collaboration Metrics
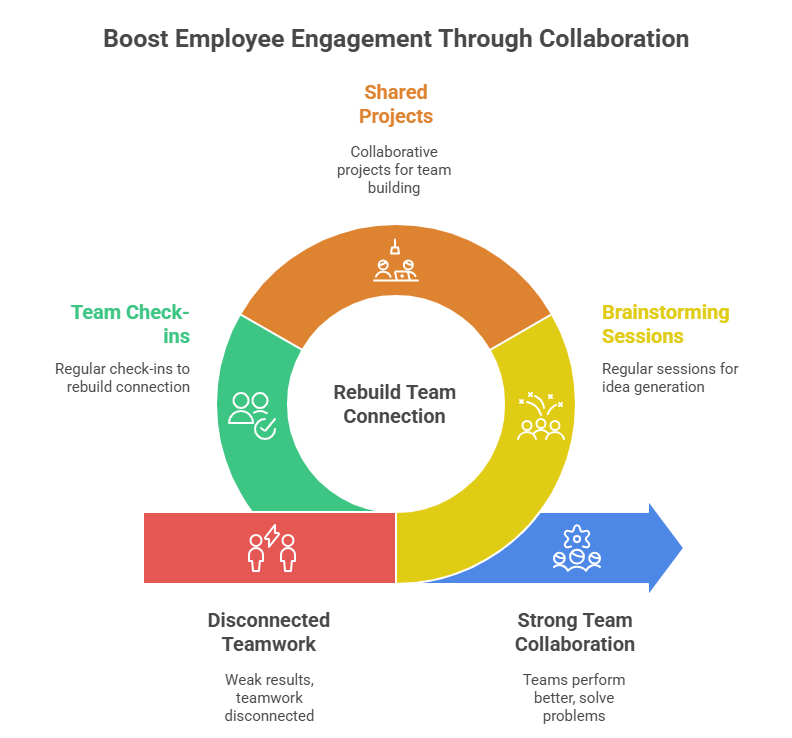
Team collaboration is the key to employee engagement. Especially for teams working remotely or following a hybrid work culture.
You can learn a lot about how well your team works together by tracking collaboration data. When collaboration is strong, teams perform better, solve problems faster, and come up with more creative ideas.
But if results seem weak or teamwork feels disconnected, it’s time to boost engagement. Try adding regular brainstorming sessions, shared projects, or team check-ins to rebuild that connection.
How to calculate:
Productivity = (Output ÷ Input)
Example: Number of tasks completed ÷ Total hours worked
See real-time team collaboration & projects
8. Work-Life Balance Indicators
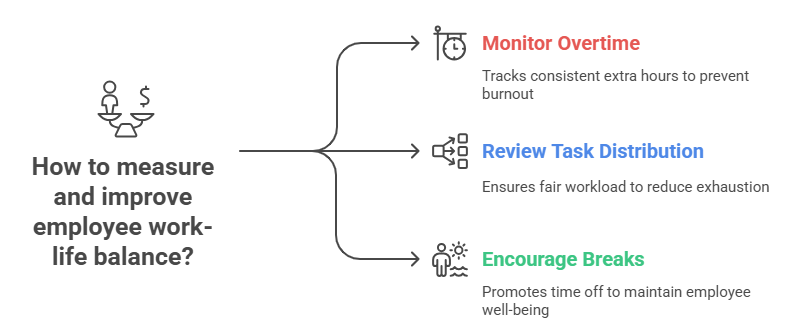
Balanced employees are more creative, focused, and loyal. To ensure an employee's engagement, measuring their work-life balance system would be a great factor in this. To measure your employee work-life balance, monitor indicators like their average overtime hours, weekend logins, or unused vacation days.
A healthy team should use its time off and avoid consistent overtime.
To avoid employee burnout, run this monitoring monthly or at least every quarter.
And to prevent an unbalanced work-life, encourage your managers to discuss workload distribution regularly. Normalize taking breaks and vacations.
If someone consistently works extra hours, review their task distribution. This will help you cut off employee exhaustion before it destroys their productivity.
How to calculate:
Work-life balance index = (Overtime hours ÷ Total hours worked) × 100
Lower overtime % usually means better balance.
Monitor overtime & working hours automatically
9. Employee Satisfaction Index (ESI)
The employee satisfaction index (ESI) metric helps organizations calculate how happy and pleased their employees are with their jobs and work environment. It is also a great way for companies to determine areas for improvement, make data-driven decisions, and foster a positive workplace.
How to calculate:
Ask employees to rate statements like “I am satisfied with my job” or “I feel valued at work” on a scale of 1–10.
Use the formula: ESI = (Total actual score ÷ Maximum possible score) × 100
10. Pulse Surveys (Quarterly)
Pulse surveys collect real-time reviews from employees or customers in a group. This survey is considered to be taken in a short and frequent way in order to see results after bringing changes to a specific area.
This type of survey focuses on key issues and gives the organization a quick look into where, how it is needed to bring changes.
How to calculate:
Use short questions like “Do you feel motivated this week?” or “Do you have the resources you need to do your job?” on a 1–5 scale.
Average the scores and track changes over time.
11. Diversity and Inclusion Index
The diversity and inclusion index shows how inclusive your culture really is. A healthy and engaged workplace is where employees feel seen, valued, and included. By following D&I employee engagement metrics how innovative, collaborative, and inclusive your business is performing across various teams.
How to calculate:
- Ask employees to rate statements like “I feel included in decision-making” or “I’m treated fairly regardless of my background.”
- Use a 1–5 scale and average responses for your overall score.
You can also track representation metrics, such as gender balance or leadership diversity, to measure diversity.
Maintain Better Engagement through Employee Engagement Metrics Surveys
It does not take that time to conduct an employee engagement metrics survey.
Instead, it shows how committed you are to improving your organization. When employees see that their opinions matter, they feel more valued and connected to their work, too.
It's always a win-win project for a business that makes employees happy and helps the organization grow, too!
So, now you know all the processes on how to conduct employee engagement surveys and leverage these strategies to track engagement.
Analyze the data you receive and make changes accordingly to celebrate your very first step into sustainable success.
Get real-time insights with smart analytics
About Author